Visualization tool for Text2Shape dataset.
This repository provides some visualization tools for Text2Shape dataset. This dataset has been introduced in 2018 and provides paired data samples of 3D shapes and text descriptions.
The 3D shapes of Text2Shape belong to the categories "chair" and "table" of ShapeNet. Text2Shape provides the voxelgrids of such objects and multiple textual descriptions for each of them. Since in our visualization, we make use of the mesh representation for the shapes, it is preferable to download directly the meshes from ShapeNet. Thus, data can be downloaded in the following way:
- 3D shapes can be downloaded from ShapeNet website (download section)
- textual descriptions can be found in a csv file, which can be downloaded from Text2Shape website (ShapeNet Downloads => Text Descriptions).
Python 3.8 is required.
Create and activate a virtual environment
python -m venv env
source env/bin/activate
Install the required libraries: BLENDER Python API bpy, Open3D and Matplolib
pip install bpy
pip install open3d
pip install wordcloudThe rendered views are captured from a virtual camera which is rotating around the 3D shape. We can specify the number of views to capture. The rendering pipeline will make sure to cover the whole range of 360 degress around the object.
To generate the rendered views for all the shapes of the dataset:
python render_shapenet_obj.py --category all --views <views_per_shape>To generate the rendered views for the shapes belonging to a single category (e.g. chairs or tables):
python render_shapenet_obj.py --category Chair --views <views_per_shape>To generate the rendered views for the shape provided as example in this repository:
python render_shapenet_obj.py
--obj_path input_examples/chair/a682c4bf731e3af2ca6a405498436716.obj
--views <views_per_shape>
The resulting renderings will be saved in the folder specified by the argument output_folder, being by default output_renders/.
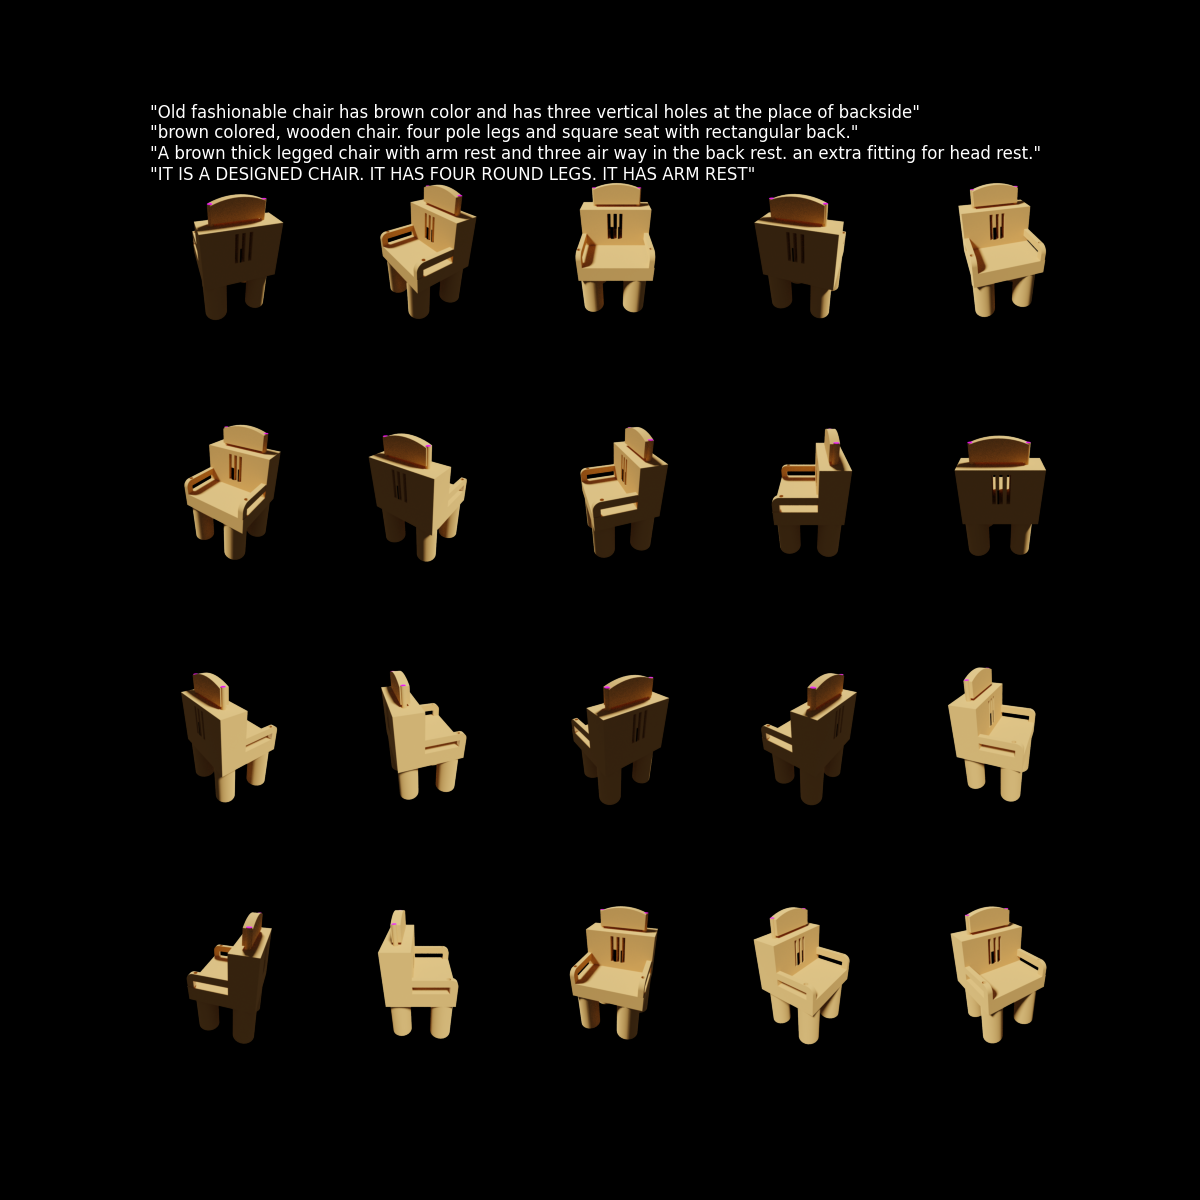
Once obtained all renderings, we can plot the views for a specific shape and the corresponding textual descriptions.
python plot_renderings.py
--obj_path <path to .obj file of the 3D shape>
For the example in this repository:
python plot_renderings.py
--obj_path input_examples/chair/a682c4bf731e3af2ca6a405498436716.obj
The output figure will we saved in the folder specified by the argument output_folder, being by default output_plots/.
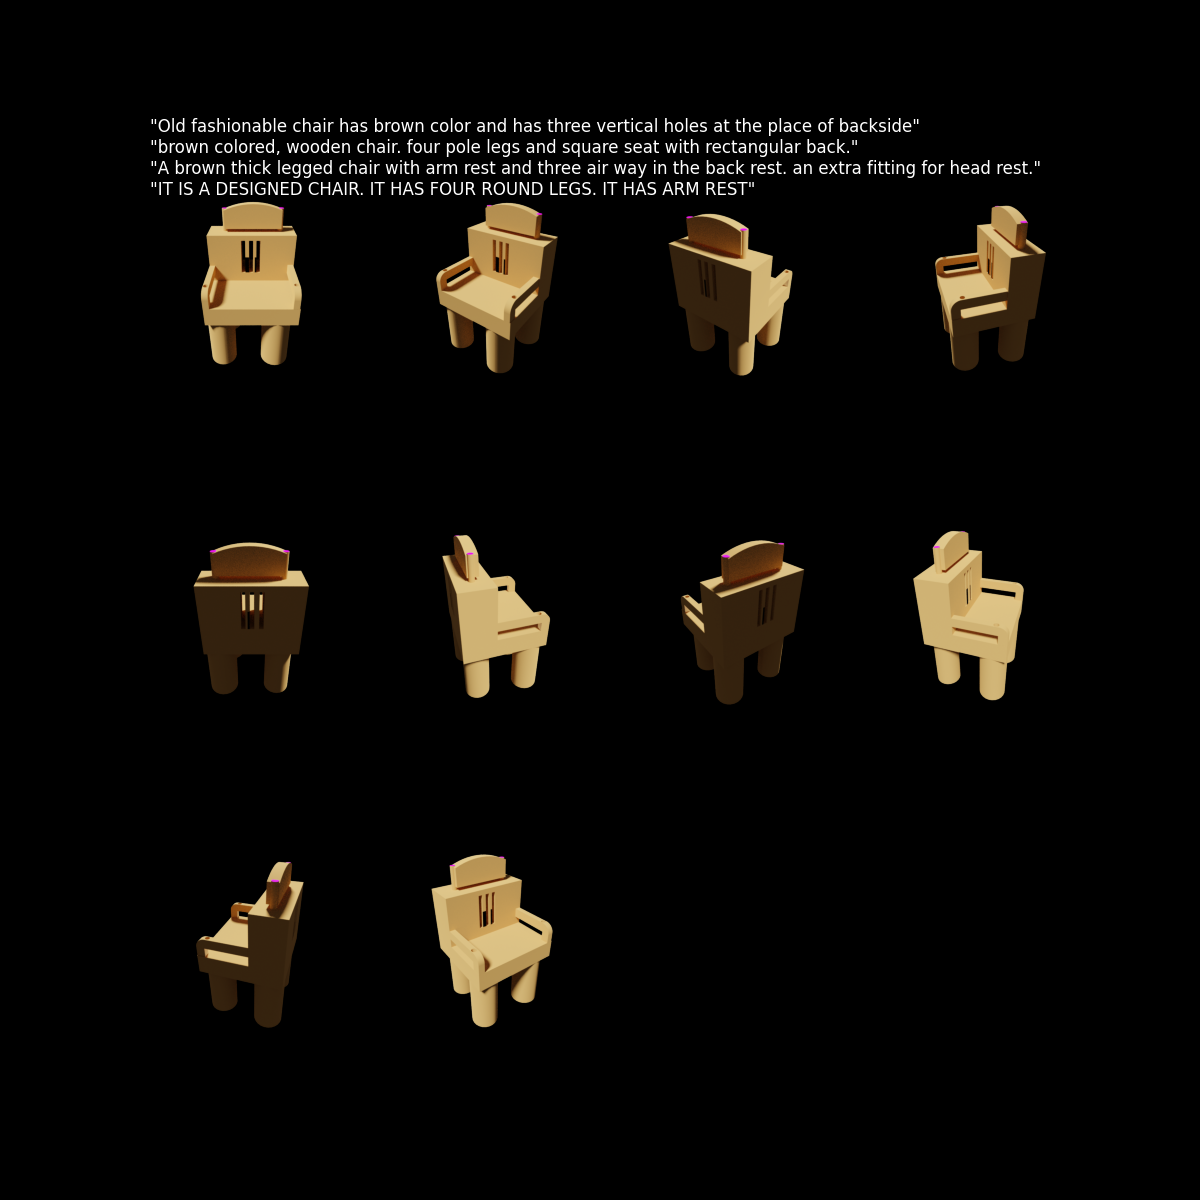
The code is able to automatically adjust the positioning and size of the views, according to their number (if 20, 10, 5...).
Below, we report the figure with 20 views and with 10 views.


Instead of generating the single rendered views, the code of this repository allows to get also an animation of the 3D object rotating around its vertical axis, to allow a comprehensive view of all its sides.
python plot_renderings.py
--obj_path <path to .obj file of the 3D shape>
--animation
We can also specify the number of frames of the video, through the argument frames.
REMARK: unlike the previous figure, this animation does not show also the textual descriptions of the object.
Below, we can see an example of such animation.

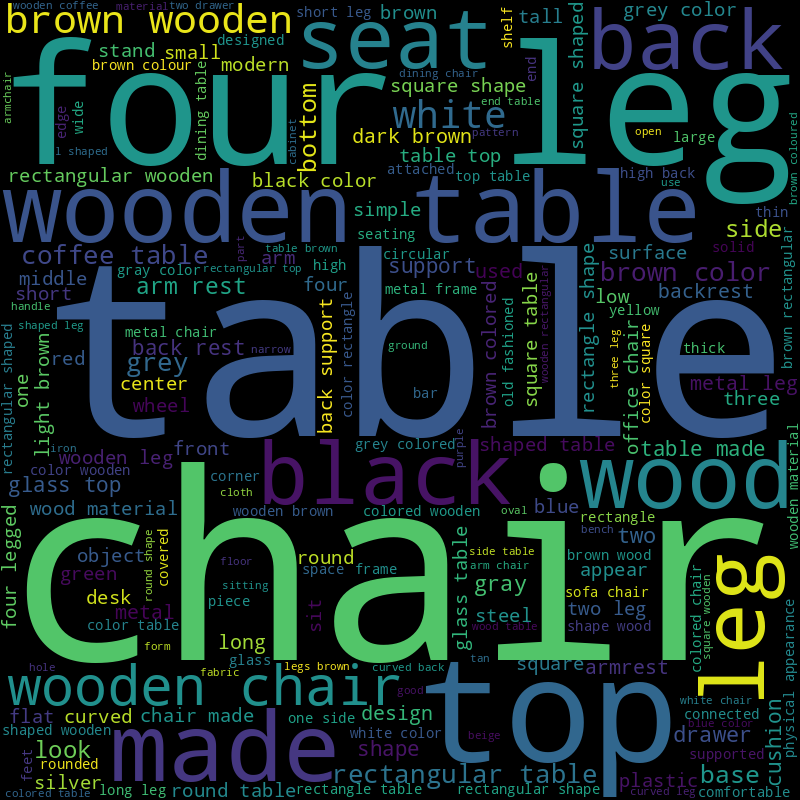
This visualization provides an understanding of the frequency with which different words appear in the textual descriptions of Text2Shape. To plot a wordcloud for the whole dataset:
python plot_text.pyTo plot a wordclous for a specific category of the dataset, such as chairs:
python plot_text.py --category ChairThe resulting figure will be saved in the folder specified by the argument output_folder, being by default output_plots/.
