Neural Network Implemented in C++: An Object Oriented Approach From Scratch With Visualizing Tools Built on Top of SFML Graphics Library.
Key Features • How To Use • Structure • Visualization • Credits • Tools • License
- Easy to build a neural network
- Apply different learning methods
- Various cost functions
- Activation functions
- For all neurons in a layer
- For individual neurons
- Train using multiple datasets
- Training using multiple datasets
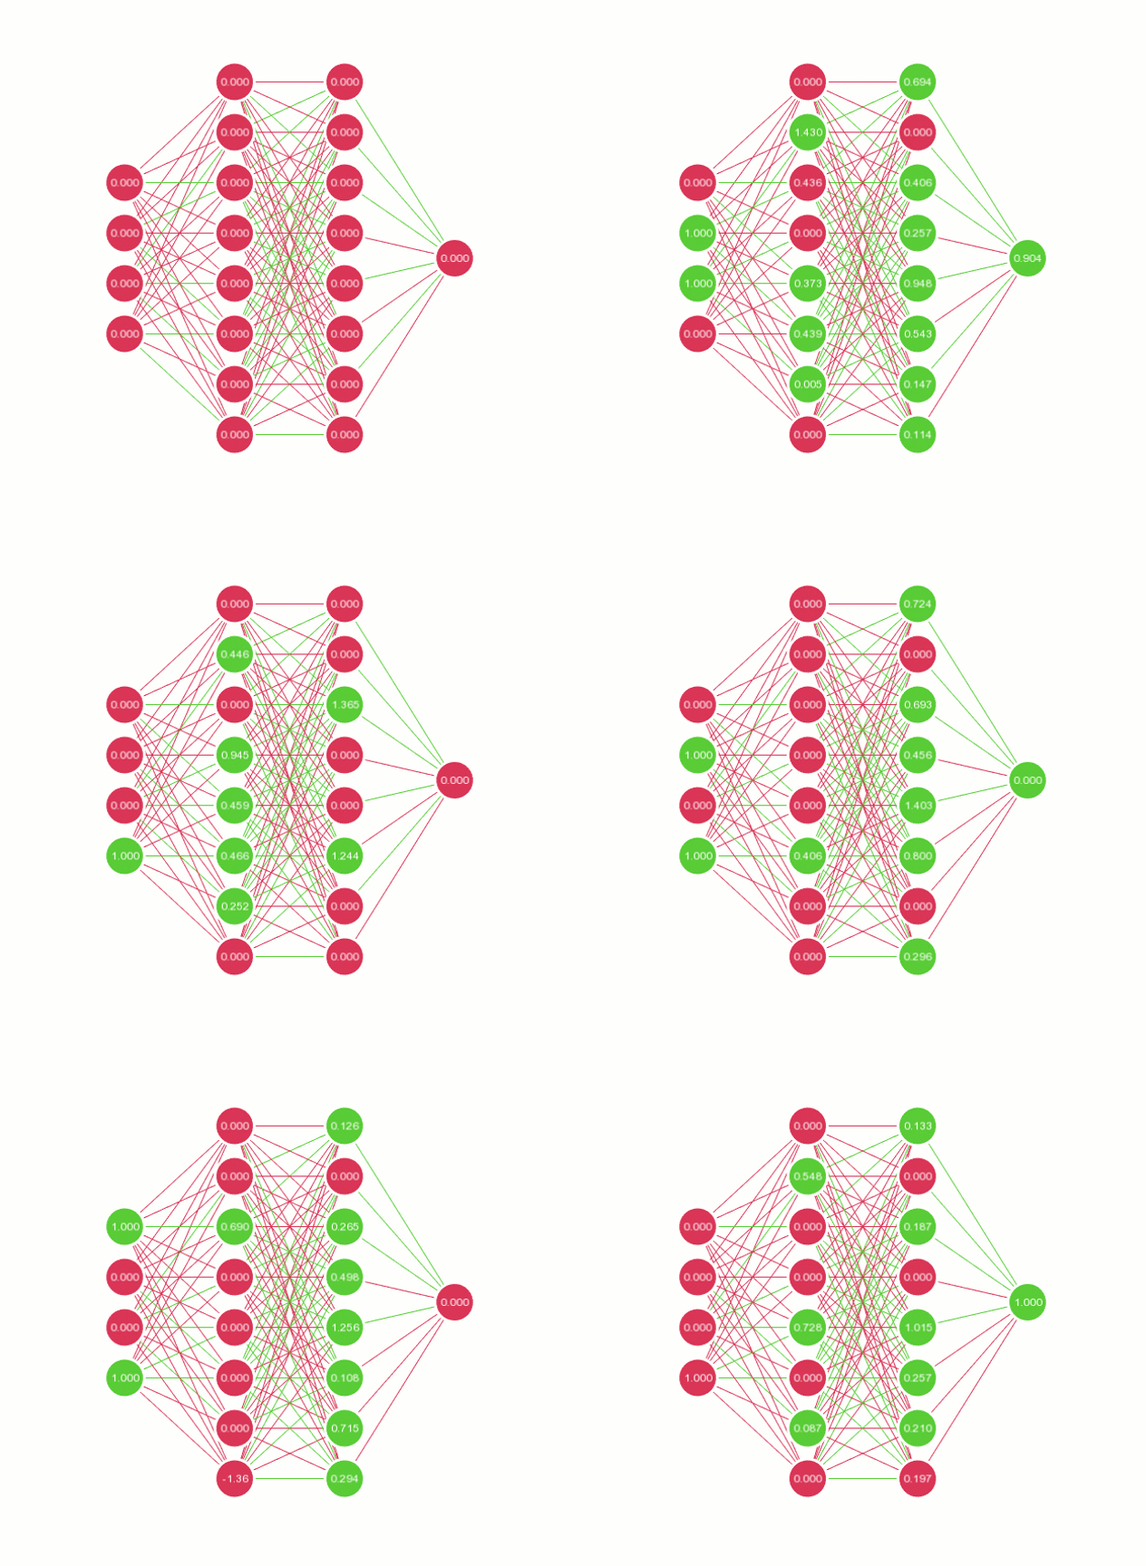
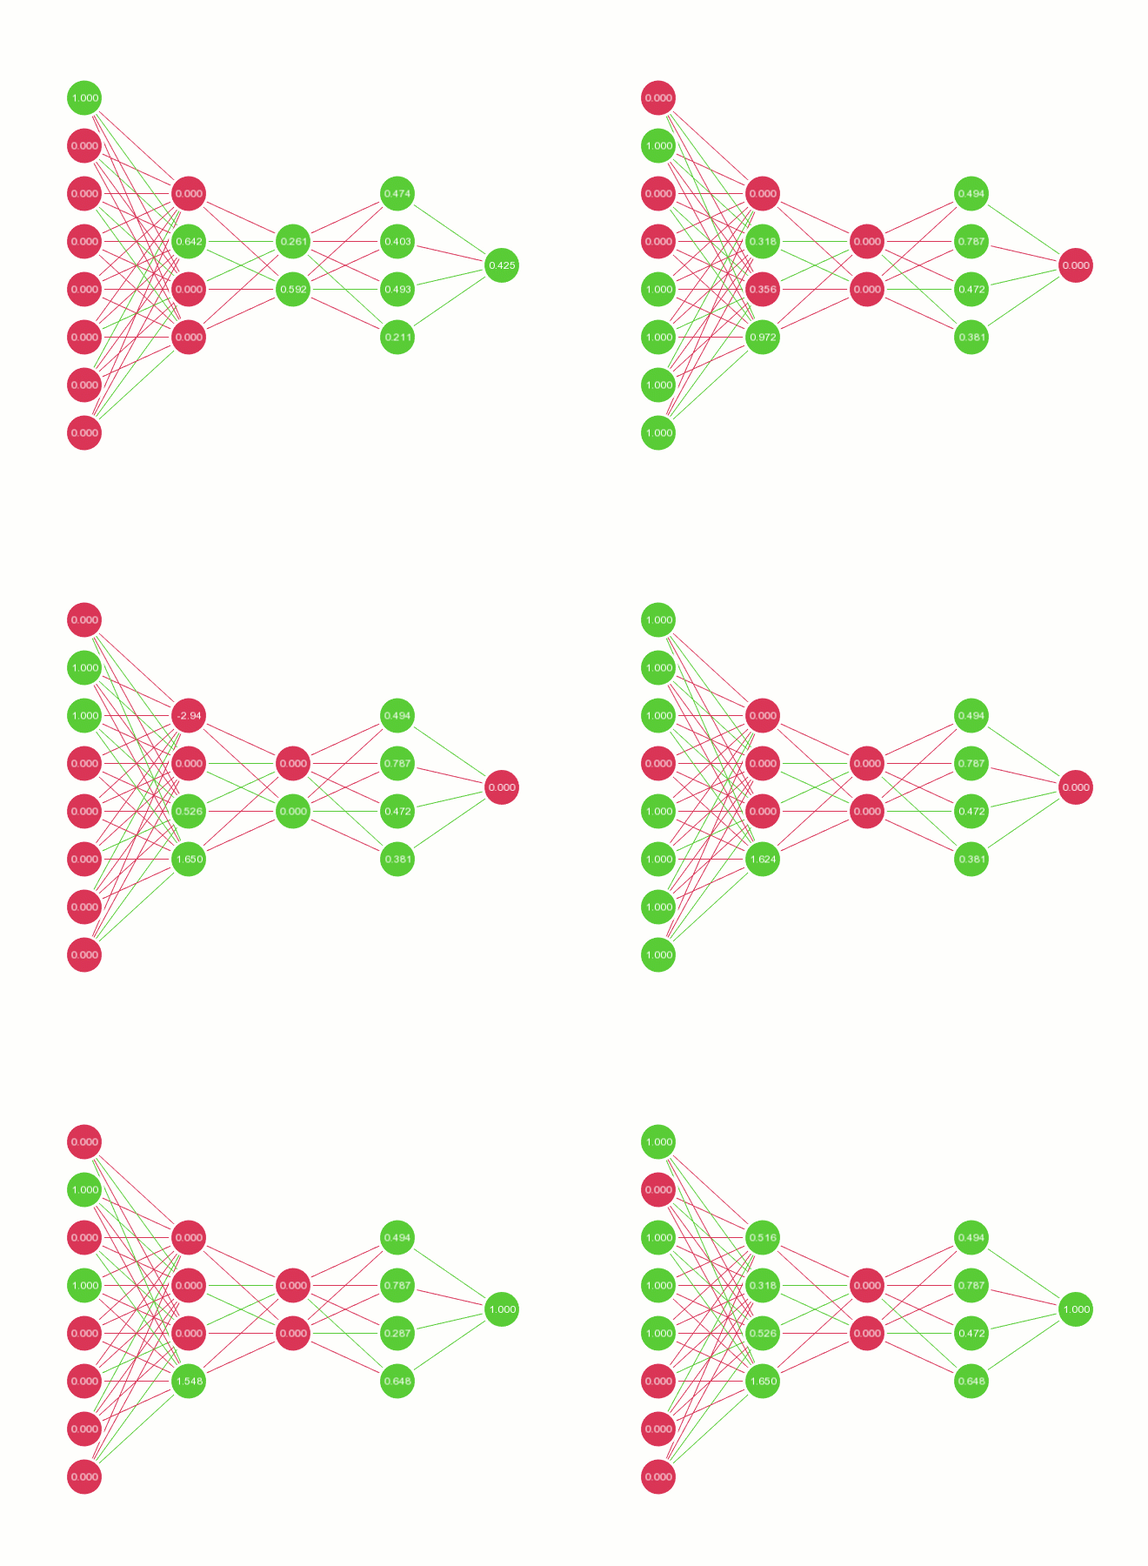
- Visualizing activation values and weights
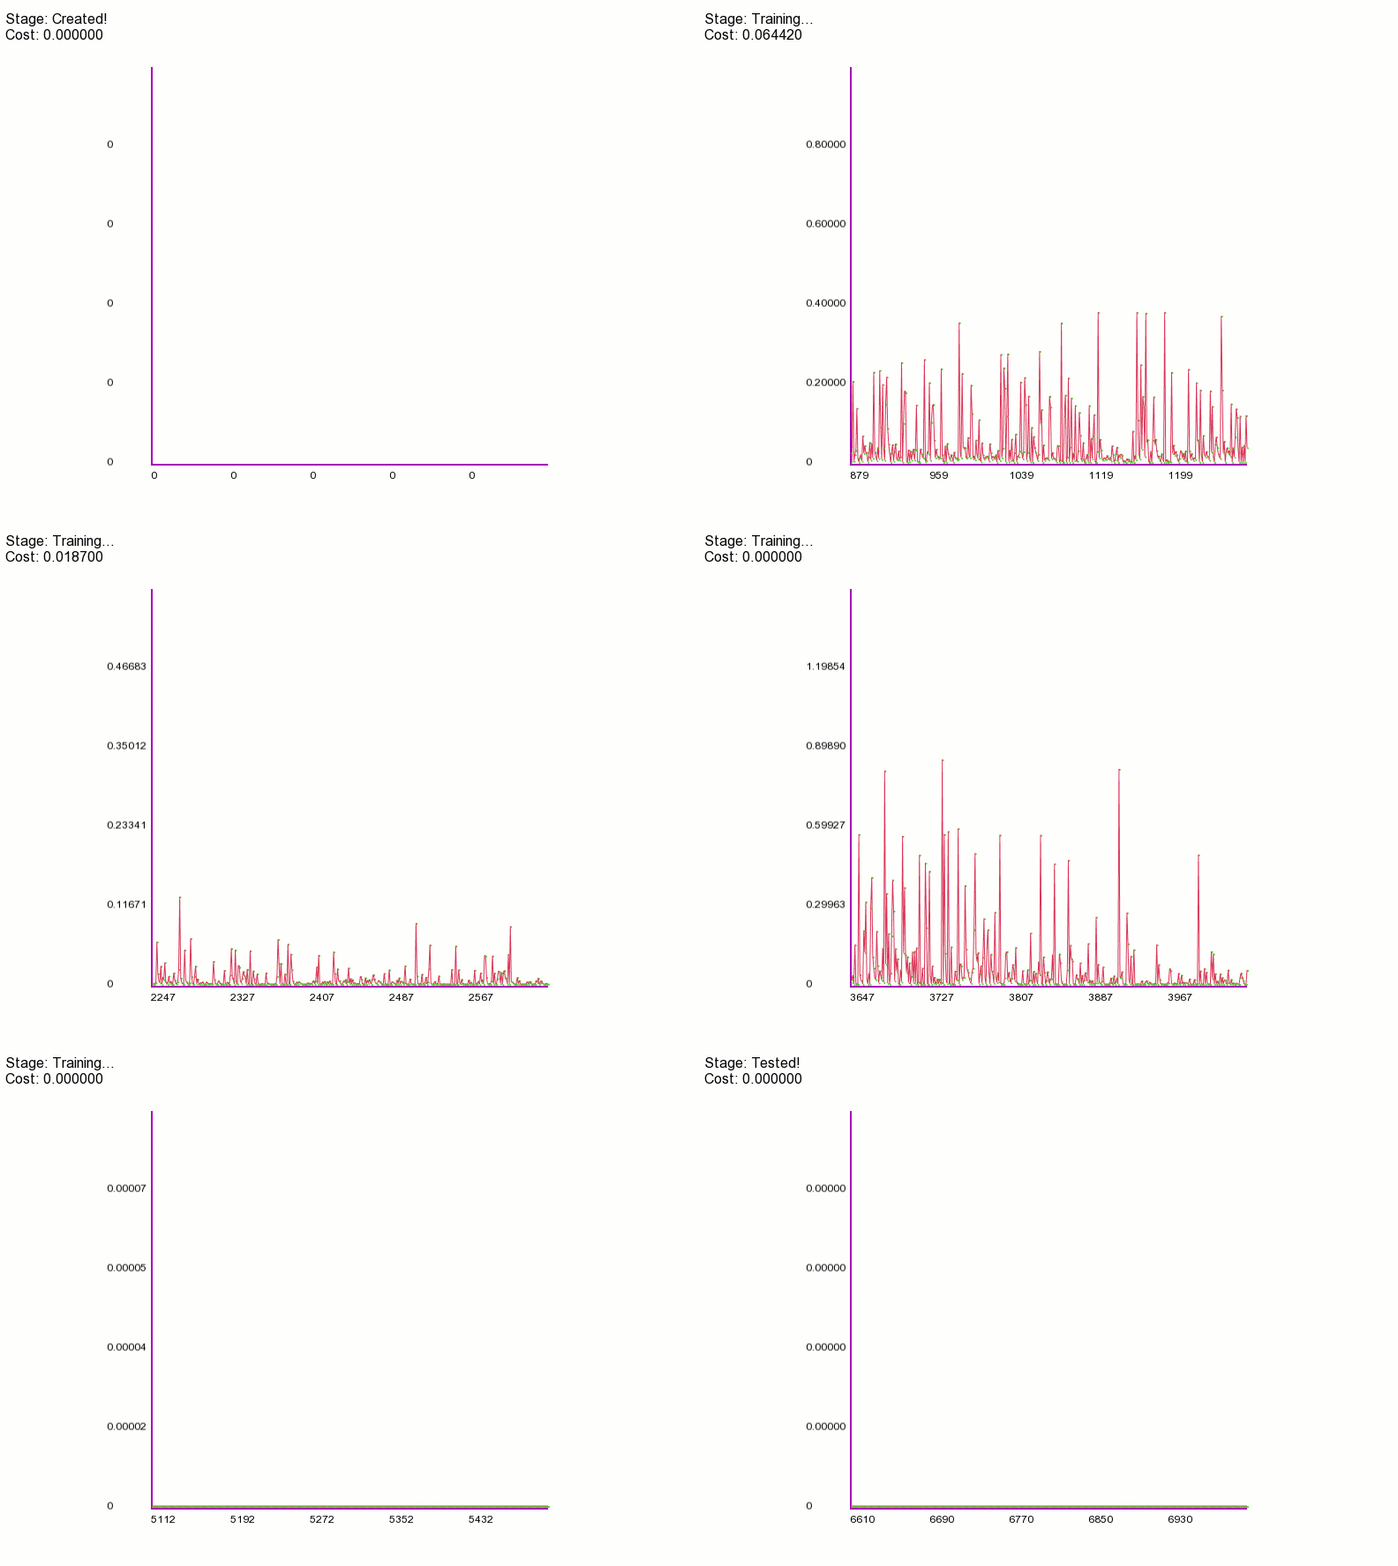
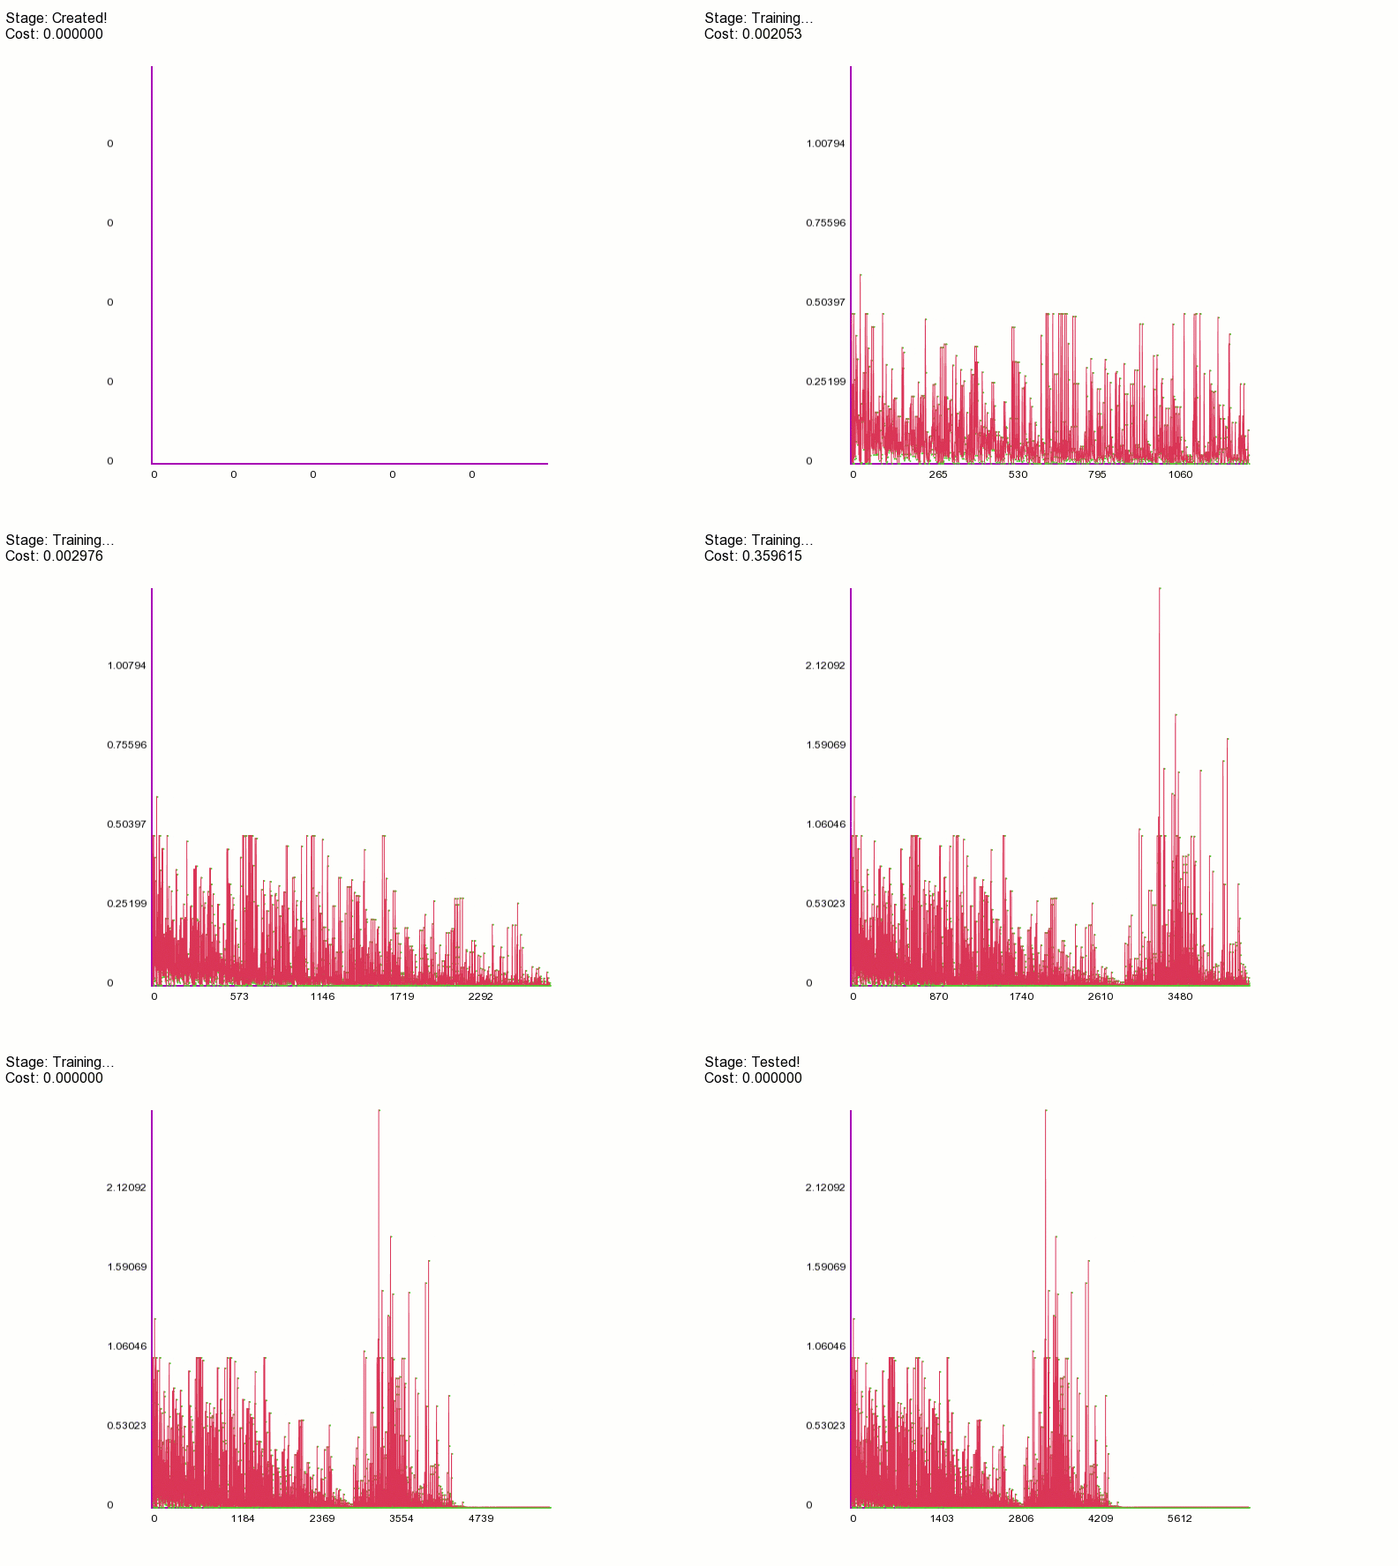
- Visualizing cost in graph as the neural network gets trained and tested
Neural network that is shown in this sample code will be learning 4-input XOR.
Builder pattern is used to build neural network layer by layer. It allows us to set Activation functions (by default, Sigmoid), number of nodes in each layer, and learning method with cost function.
	int numberOfInputs = 4;
	int numberOfHiddenLayerNodes = 8;
	int numberOfHiddenLayerNodes2 = 8;
	int numberOfOutputs = 1;

	NeuralNetwork* nn = (new NeuralNetwork::Builder())
		->addLayer(new Layer(numberOfInputs))
		->addLayer(new Layer(numberOfHiddenLayerNodes, new ReLU()))
		->addLayer(new Layer(numberOfHiddenLayerNodes2, new ReLU()))
		->addLayer(new Layer(numberOfOutputs, new ReLU()))
		->setLearningMethod(new GradientDescent(new MSE())) // Mean Squared Error
		->build();
Creating a window to visualize the state of weights and nodes as well as their activation values. Whenever the Window object started (with startWindow() function) a new thread is created so that calculations for neural network can be carried out in the main thread preventing it from lags in the animation and slowing down the whole process.
	// This class provides data communication between Window and NeuralNetwork objects
	NNVisualAdapter* nnVisualAdapter = new NNVisualAdapter(nn);

	Window* nnWindow = new Window(
				sf::Vector2i(700, 600), 	// Screen dimensions
				sf::Vector2i(20, 50), 		// Screen position
				"Neural Network Structure"	// Screen title
				);

	// Adding adapter to nnWindow will be enough for
	// Window to draw it.
	nnWindow->addAdapter(nnVisualAdapter);

	// Starts in a new view thread
	nnWindow->startWindow();
Graph for showing the cost of training or testing can also be created in a similar way. Only difference here is the type of graph which can be selected by adding an instance of the graph type (LastNRange(nRange, yScaleFactor) or FullRange(yScaleFactor)).
	NNGraphAdapter* graphAdapter = new NNGraphAdapter(nn, new LastNRange(400, 170));

	Window* graphWindow = new Window(
				sf::Vector2i(800, 600), 	// Screen dimensions
				sf::Vector2i(720, 50),      	// Screen position
				"Cost Graph"                	// Screen title
				);

	graphWindow->addAdapter(graphAdapter);

	// Starts in a new view thread
	graphWindow->startWindow();
Training neural network is as easy as calling nn->train(trainingDataSet, learningRate, numberOfIterations) function.
	DataSet* trainingDataSet = new DataSet("data4.data", numberOfInputs, numberOfOutputs);

	double learningRate = 0.0314;
	int numberOfIterations = 7000;

	nn->train(
		trainingDataSet,
		learningRate,
		numberOfIterations
	);
Note that DataSet class will automatically read the data from file. By default, it accepts that every new line in the file is a new case and first numberOfInputs amount of numbers are taken as input and next numberOfOutputs amount of number will be stored as expected output values.
In this case, data4.data file contains the data shown below. First 4 numbers are the input for neural network and last digit is the expected value of the output. It is used for training the neural network and calculating the cost.
0 0 0 0 0
0 0 0 1 1
0 0 1 0 1
0 0 1 1 0
0 1 0 0 1
0 1 0 1 0
0 1 1 0 0
0 1 1 1 1
1 0 0 0 1
1 0 0 1 0
1 0 1 0 0
1 0 1 1 1
1 1 0 0 0
1 1 0 1 1
1 1 1 0 1
1 1 1 1 0
Testing is done in a similar manner:
	// Dataset test
	DataSet* testingDataSet = new DataSet("data4Test.data", numberOfInputs, numberOfOutputs);

nn->test(testingDataSet);Want to learn more about its architecture? Take a look at class diagram of the whole project.
To visualize the cost and its previous values graph can be used. NNGraphAdapter is used to render a graph on the window.
NNGraphAdapter(NeuralNetwork* nn, GraphRangeStyle* graphRangeStyle);
There are currently two different types of GraphRangeStyle:
LastNRangetype graph illustrates only lastnnumber of the cost data. Its constructor takes two arguments:nRange- which is how many of the last number should be presented on the graph andyScaleFactor- which is to scale up or down the cost value. It can be useful when the difference between cost values are very small.
NNGraphAdapter* graphAdapter = new NNGraphAdapter(nn, new LastNRange(400, 170));
FullRangetype graph contains and presents all the cost data at once. Its constructor has only one argumentyScaleFactor.
NNGraphAdapter* graphAdapter = new NNGraphAdapter(nn, new FullRange(170));
This software uses the following open source package:
Following tools are used to build this project:
- Visual Studio
- C++
MIT
GitHub @emiraslan · GitHub DummyTeam ·
