Tooling user studies tasks is fundamental to reduce the burden of evaluators, practitioners, facilitators, and observers during user interface (UI) evaluations. However, available tools for collecting detailed data (i.e., beyond clicks streams) are paid or have a complex setup. In this context, we propose a general-purpose web browser plugin for Firefox to be used in local user studies. It provides detailed data logging, log download, and reporting features. The tool is freely available so that Human-Computer Interaction (HCI) practitioners can use it as a core tool for empirical evaluations or additional data source in mixed methods evaluations.
The easiest way to tryout the tool is to:
- Download the zip file located at https://github.com/IBM/user-test-logger/archive/master.zip;
- Unzip the downloaded file and place it at your preferred location;
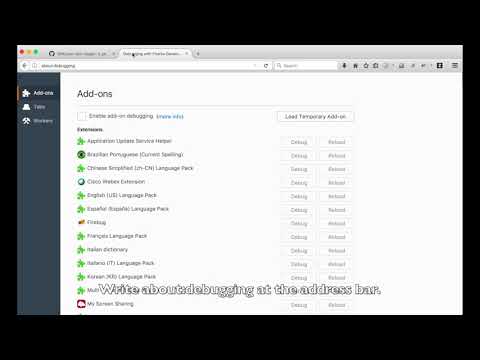
- Write
about:debuggingat the address bar; - Click on
Load Temporary add-on; - Locate the
manifest.jsonfile and selected it; - Confirm.
Checkout this video showing the setup procedure:
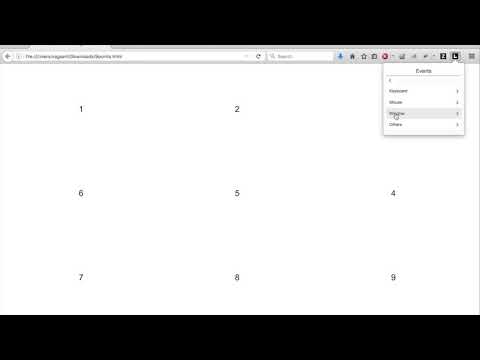
Once the plugin is loaded, you will be able to see the L icon. After clicking at the L icon, you will be able to select the events of interest grouped by type of event, e.g., mouse, keyboard, etc.
Once you select the events of interest, you can click Record. After that, all events triggered of the type you selected will be logged.
Checkout this video showing the logging procedure:
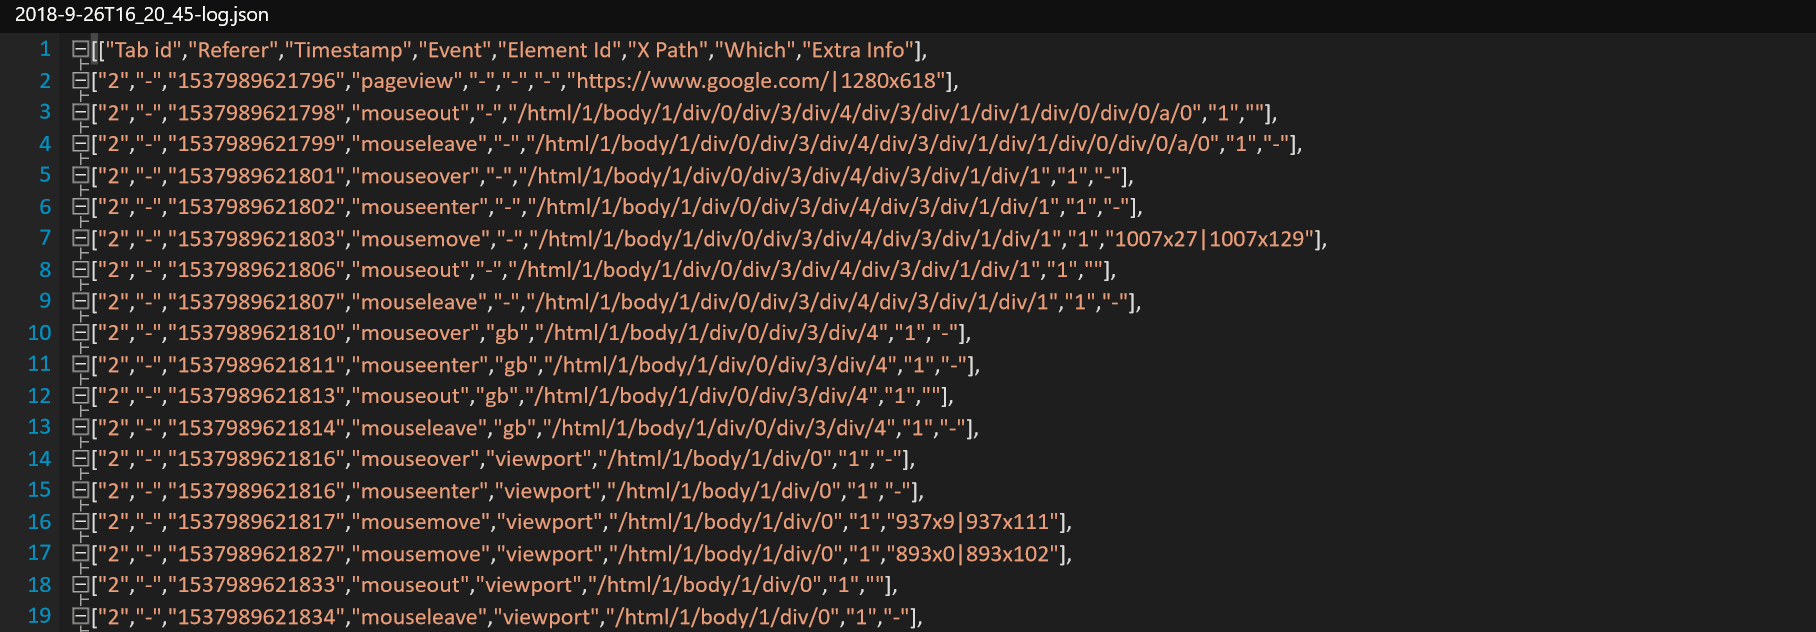
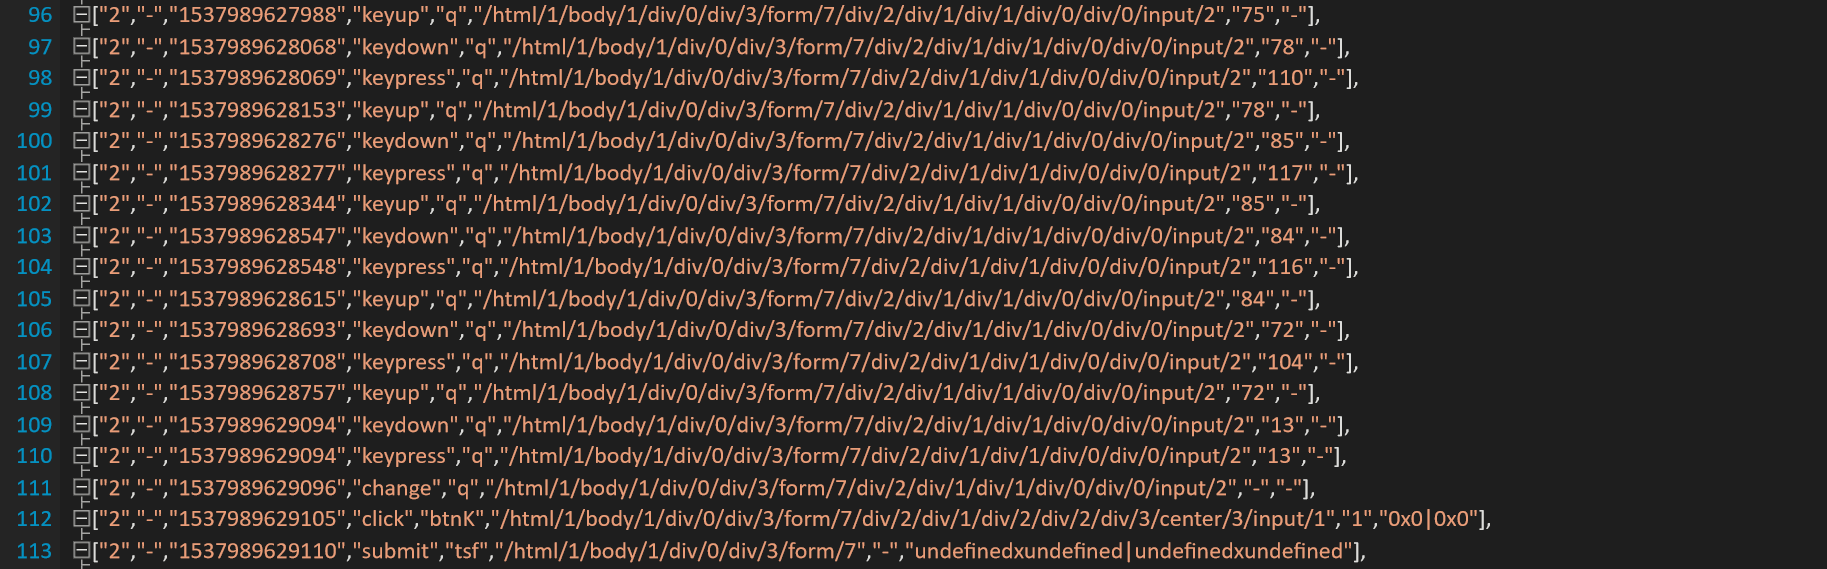
The log file contains all the DOM events triggered during the recording. It can be downloaded by clicking on "Dump raw data". Each line in the log file is an event, whose structure is described by the first line.
A simple task of searching a name at google was performed as an example:
At the beginning of the file, it's possible to see the header containing the log lines' structure and the "pageview" event triggered at the google page:
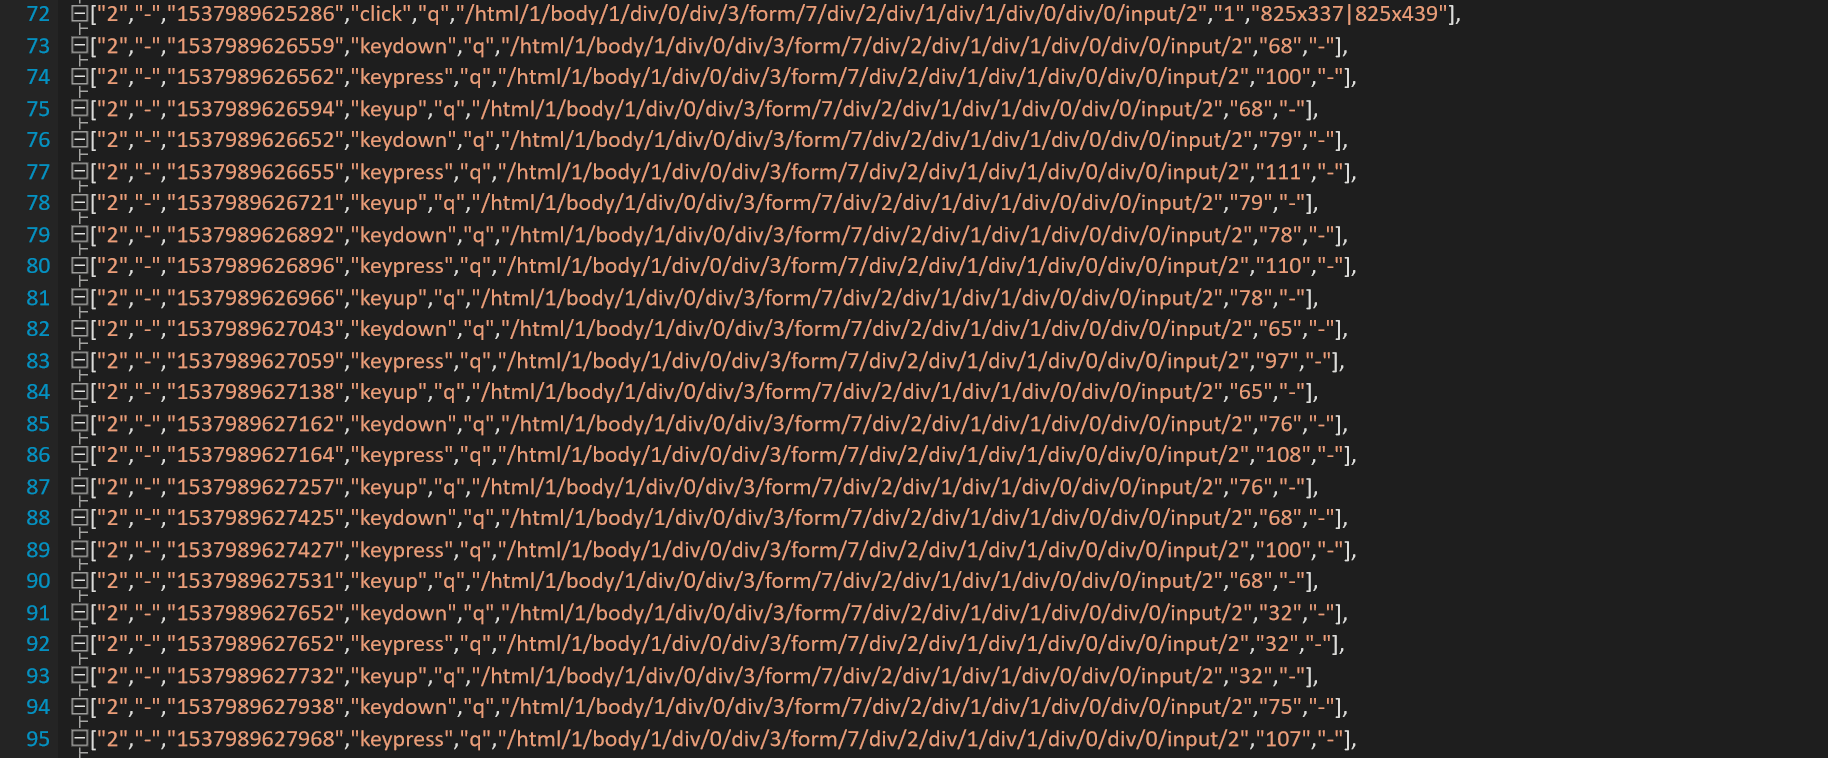
Next, the search with the name "donald knuth" is submitted:
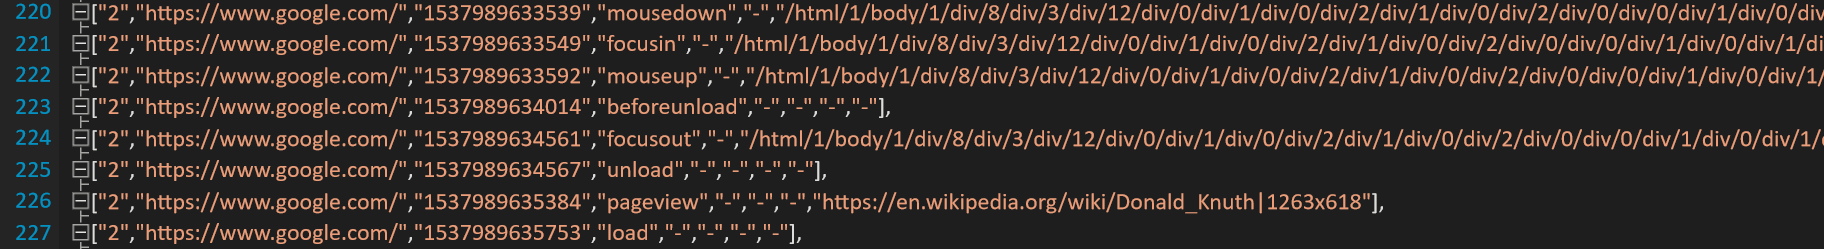
Then the search web address is loaded:


Finally, wikipedia page about Donald Knuth is reached:
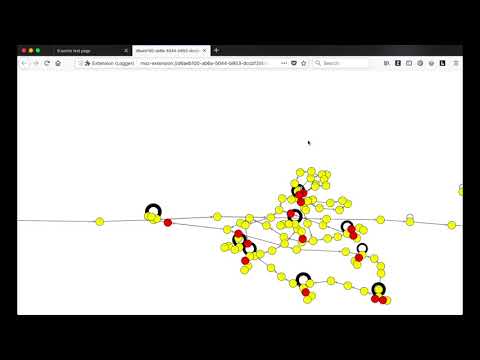
The usage graph can also be seen as the combination of walks (non-empty alternating sequence of nodes and edges) representing what, where, and when users performed actions. In the usage graph a node is identified by its label, which is the concatenation of the event name and an identifier of the UI element where the event occurred. Moreover, each node counts on information regarding the total of sessions they occurred, mean distance from the root node, mean timestamp, among others.
For more details, please refer to the paper WELFIT: A remote evaluation tool for identifying web usage Patterns through client-side logging, from Santana and Baranauskas.
The heatmap is a simplified version of a fixation visualization, usually used for analyzing eyetracking results. The heatmap generated by the tool is performed according to the mouse events. It considers mouse fixations, as an analogy to eye fixations. The fixations are computed according to the dispersion algorithm presented in the paper Identifying fixations and saccades in eye-tracking protocols, from Salvucci and Goldberg.
The mouse plot shows mouse movements, clicks and double clicks. It can be useful for comparing task performance and showing user's mouse path.
Checkout this video showing an overview of reporting capabilities:
Please cite as: Santana, V. F., and Silva, F. E. F. 2019. User Test Logger: An Open Source Browser Plugin for Logging and Reporting Local User Studies. In Proceedings of XXI International Conference on Human-Computer Interaction (HCII 2019). Springer.