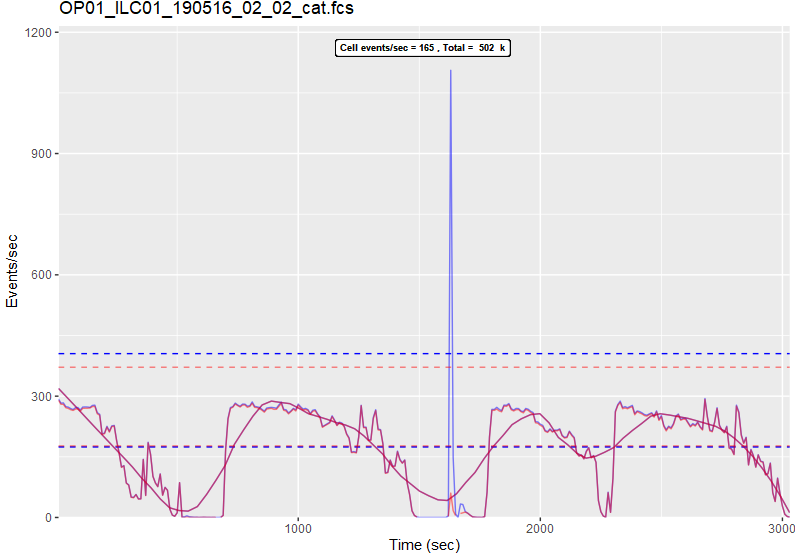
R Script to plot the average event rate in flow or mass cytometry (FCS) files.
As per the description, I created this script as a "QC" step to examine the rate of flow of cells (flow/mass/CyTOF) and/or events and cells (mass/CyTOF) on a flow or mass (CyTOF) cytometer.
I got the idea from another package, FlowAI. That package could (and should?) be used to cleanup any data that has big spikes in the flow rate.
Copy / paste and run the script in R and perhaps in an IDE such as R-Studio
Flow
Mass (CyTOF)
This is quite an interesting dataset because it's been concatenated and also shows all events (blue) as well as cell events (red). There must have been a huge spike in contamination or some other non-cell material about halfway through.

Please report any bugs / suggestions here.
