This is a simple implementation for approximating the C-value used in Pseudo Random Distribution (PRD).
The script is designed to generate a dataset of C-values. It runs simulations for each to approximate the average probability. Simulations are run in parallel and the precision of the C-value is controlled to keep the run time reasonable.
This is a sample of some (formatted) data generated by the script:
| C-value | Probability | Expected Value |
|---|---|---|
| 0.01 | 8.1793% | 12.225970 |
| 0.02 | 11.6901% | 8.554220 |
| 0.03 | 14.4513% | 6.919770 |
| 0.04 | 16.7753% | 5.961140 |
| 0.05 | 18.8255% | 5.311920 |
Check out the ./sample/ dir for more info.
Running the script outputs a CSV with 3 columns: the C-value, the probability, and the expected value. There are some constants at the top of the file that can be adjusted.
You can simply run the script with:
go run .Or, probably more useful, dump the results to a CSV:
go run . > out.csvPRD was first introduced in Warcraft 3 and later adopted in Dota 2. It seeks to address the issue of unfair randomness in multiplayer games where players can have streaks of being extremely lucky or unlucky. Both cases can lead to an unfair advantage and a frustrating experience.
Unlike uniform distributions where each coin flip or dice roll is independent, PRD uses dependent randomness. The probability of an event occuring is based on how many times in a row it has failed to occur. As the number of attempts increases, so does the probability. To offset the fact that the probability increases, the initial probability is lowered.
The probability of an event happening starts at an initial value called the C-Value. Every time the event fails to occur, the probability of the next attempt increases by the C-value. This continues until the event occurs, or the probability exceeds 100% (at which point it must occur). Once it occurs, the probability resets back to the initial C-value.
In practice, this means two things:
- Lucky streaks are unlikely due to the initial probability being lower
- Unlucky streaks are reduced/impossible. An event must occur after a certain number of attempts
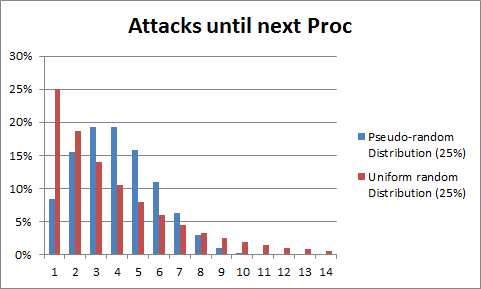
This chart shows the distributions for an event with a 25% chance of occuring. (Image source: Dota2 Wiki)
With true randomness, there is a 25% chance for the first trial. Meanwhile, PRD uses a ~8.5% chance, or 3 times less likely for the event to occur on the first try.
PRD also has no values past the 10th trial -- at that point the probability has exceeded 100% and the event is guaranteed to occur. While not shown, the number of trials continues indefinitely for the uniform distribution.
It's also no coincidence that the PRD distribution is concentrated around the 4th trial. Using a C-value of ~8.5% will average out to a 25% chance given a sufficient number of samples.
If you check the included sample dataset, you'll notice that a C-value of ~0.085 would fit perfectly between 0.08 and 0.09 in the table.
