-
Notifications
You must be signed in to change notification settings - Fork 30
ADF tutorials and examples
Casper is NCAR's main data analysis and visualization machine, and thus a likely location where one would want to run diagnostics. This package is always tested on Casper before any code modifications are accepted, and so should thus always work on Casper out of the box. Additional information on the Casper system, including access and computer time accounting, can be found online here.
git clone https://github.com/NCAR/ADF
module load nco
module unload python
module load conda/latest
conda activate npl
All run-time settings are in config_cam_baseline_example.yaml. We recommend you copy this file to another name that can be modified for different invocations. This example uses config_example_mine.yaml
cd ADF
cp config_cam_baseline_example.yaml config_example_mine.yaml
<open> config_example_mine.yaml
where <open> is a place-holder for whatever text editor you prefer (vim, emacs, nano, etc.).
5. In the file, there are several variables that must be set. They are (in order of appearance in the file):
In diag_basic_info config group:
-
cam_regrid_loc:Location where regridded CAM climo files will be saved. -
cam_diag_plot_loc:Location where the diagnostics plots and figures will be saved.
In diag_cam_climo config group:
-
cam_case_name:The name of the CAM run (case) that you are analyzing. -
cam_hist_loc:Location of the actual CAM history files you are analyzing. -
cam_climo_loc:Location where the CAM climatology (climo) files will be saved. -
start_year:First CAM year to include in diagnostics. -
end_year:Last CAM year to include in diagnostics. -
cam_ts_loc:Location where the CAM time-series files will be saved.
In diag_cam_baseline_climo config group:
-
cam_case_name:The name of the CAM baseline run (case) that you are going to compare against. -
cam_hist_loc:Location of the actual CAM baseline history files being compared against. -
cam_climo_loc:Location where the CAM baseline climatology (climo) files will be saved. -
start_year:First CAM baseline year to include in diagnostics. -
end_year:Last CAM baseline year to include in diagnostics. -
cam_ts_loc:Location where the CAM baseline time-series files will be saved.
Although that looks like a lot of different variables, it should be noted that many of them will likely only need to be set once (e.g. directories where diagnostic output files are stored), and so subsequent CAM diagnostic runs will likely require less modifications.
./run_adf_diag config_example_mine.yaml
On your terminal screen, you should see output that looks like this:
CAM diagnostics is starting...
  Generating CAM time series files...
         □ time series for SWCF
         □ time series for LWCF
         □ time series for PSL
         □ time series for Q
  ...CAM time series file generation has finished successfully.
  Generating CAM time series files...
         □ time series for SWCF
         □ time series for LWCF
         □ time series for PSL
         □ time series for Q
  ...CAM time series file generation has finished successfully.
  Calculating CAM climatologies...
         □ climo calculation for SWCF
         □ climo calculation for LWCF
         □ climo calculation for PSL
         □ climo calculation for Q
...CAM climatologies have been calculated successfully.
  Calculating CAM climatologies...
         □ climo calculation for SWCF
         □ climo calculation for LWCF
         □ climo calculation for PSL
         □ climo calculation for Q
...CAM climatologies have been calculated successfully.
  Regridding CAM climatologies...
         [□] regridding SWCF (known targets: 1)
         [□] regridding LWCF (known targets: 1)
         [□] regridding PSL (known targets: 1)
         [□] regridding Q (known targets: 1)
...CAM climatologies have been regridded successfully.
  Generating lat/lon maps...
         □ lat/lon maps for SWCF
         □ lat/lon maps for LWCF
         □ lat/lon maps for PSL
         □ lat/lon maps for Q
         □ skipping lat/lon map for Q as it doesn't have only lat/lon dims.
  ...lat/lon maps have been generated successfully.
  Generating zonal mean plots...
         □ zonal mean plots for SWCF
         □ zonal mean plots for LWCF
         □ zonal mean plots for PSL
         □ zonal mean plots for Q
Q has lev dimension.
/glade/u/apps/dav/opt/python/3.7.5/gnu/8.3.0/pkg-library/20191211/lib/python3.7/site-packages/xarray/core/nanops.py:140: RuntimeWarning: Mean of empty slice
  return np.nanmean(a, axis=axis, dtype=dtype)
  ...Zonal mean plots have been generated successfully.
CAM diagnostics has completed successfully.
There might also be messages that looks like this:
<directory_path> not found, making new directory
Where <directory_path> are the paths you specified in the config (config_cam_baseline_example.yaml) file. Specifically, this message will show up if the directory path you provided doesn't actually exist yet, in which case the diagnostics package will make the directory for you. Finally you might also see a bunch of messages like this:
Interpolation point out of data bounds encountered
Feel free to ignore those for now (they are coming from a GeoCAT call, but the final output will be OK).
Currently the diagnostics package should complete in ~15 minutes. After it is finished, go to the directory specified by the cam_diag_plot_loc variable in the modified config file. There you should see a newly created directory labeled:
<case_name>_vs_<baseline_case_name>
where <case_name> is the CAM run name specified in the cam_case_nameconfig variable, and <baseline_case_name> is the CAM baseline case name specified in the cam_baseline_case_name config variable. Inside there should be a collection of PNG files that look like this screenshot:

with the naming convention being:
<varname>_<season>_<plot_type>.png
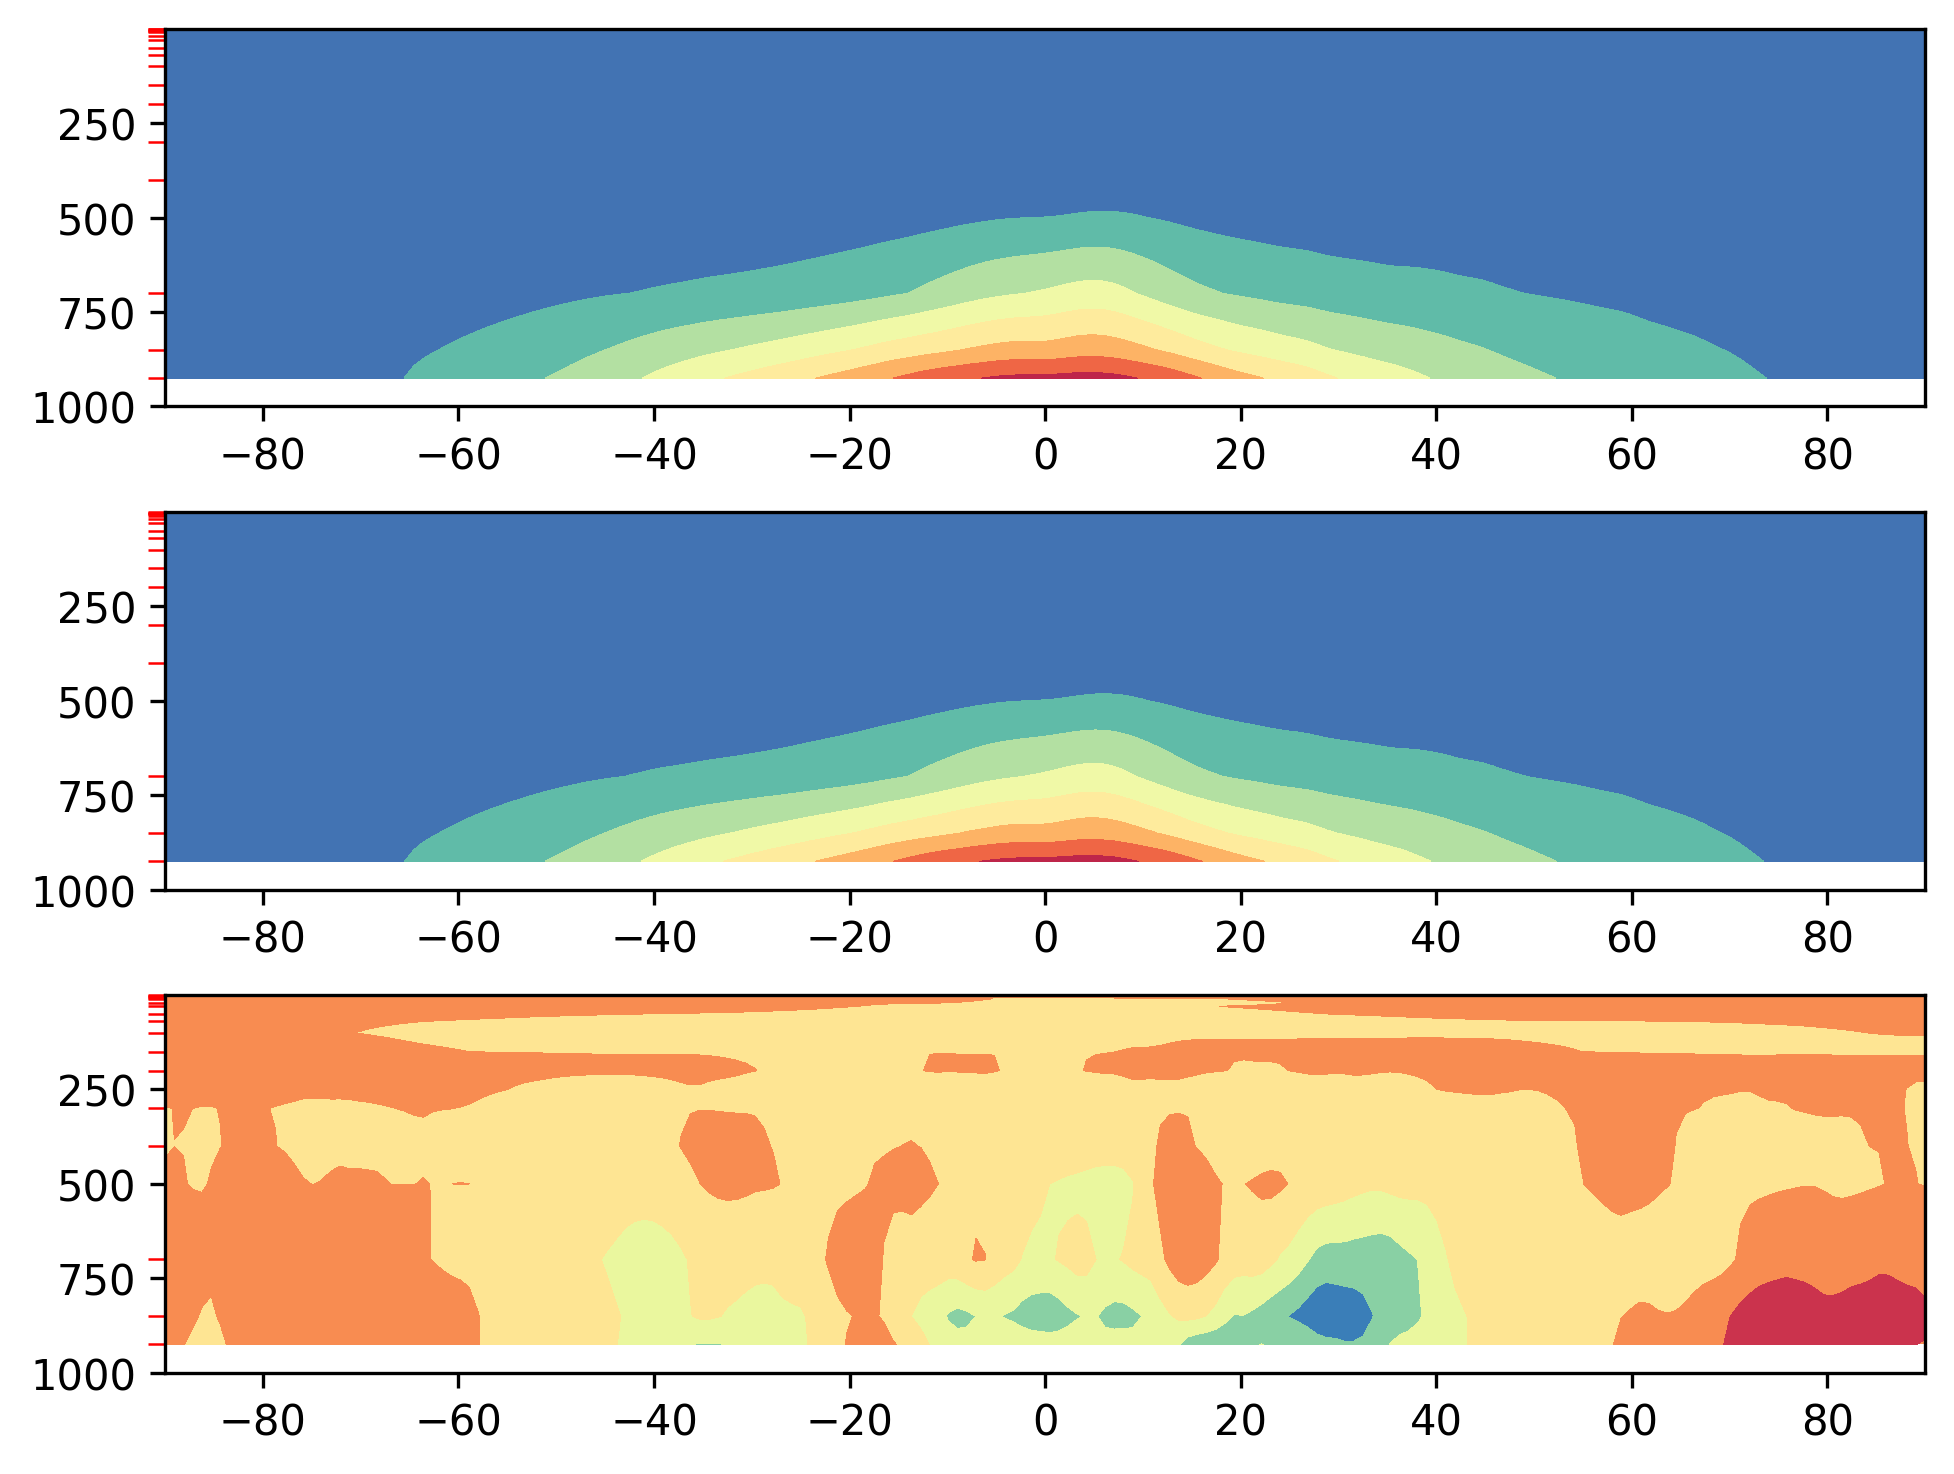
Where <varname> is the name of the CAM variable, <season> is the seasonal average (with "ANN" being the annual mean), and <plot_type> being the specific kind of plot (currently either a 2-D lat/lon map or a zonal mean plot).
The "Mean_LatLon" plots should look like so:

Whereas for 2-D (e.g. surface) variables, the "Zonal_Mean" plots should look like this:

and for 3-D variables (e.g. variables with vertical levels), the "Zonal_Mean" plots should look like this:

If all looks OK, then congrats on successfully running a CAM vs. CAM comparison on Casper! Feel free to create your own diagnostics config file, where you can add any variables and/or plotting scripts or routines that you see fit. Good luck!