-
Notifications
You must be signed in to change notification settings - Fork 144
VSCode Debugger Setup
This assumes you have the extension source code in it's own project directory and that you have configured SketchUp to load the extension directly from that location.
In order to debug Ruby code that runs inside of SketchUp we need to configure the debugging communication between SketchUp and the IDE.
Fetch the debugger dll/dylib from our GitHub repository: https://github.com/SketchUp/sketchup-ruby-debugger
Follow the instructions in the README for where to install the debugger library. You need at least version 1.1.0.0 to be able to debug from Visual Studio Code.
Next we can set up Visual Studio Code.
Before continuing, make sure you have the Ruby extension for Code installed.

To allow Code to launch SketchUp in debug mode we need the assistance of a little launcher task.
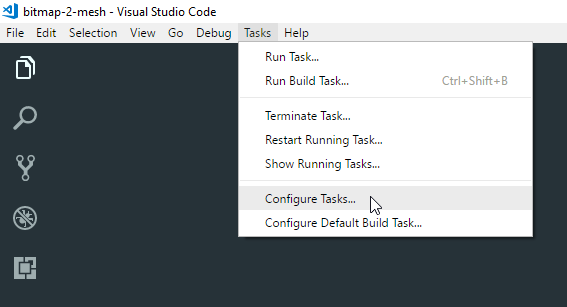
From the Tasks menu choose Configure Tasks...:
If you haven't created tasks for your project yet you will be prompted to do so:

Code will open a file tasks.json where can configure it to launch SketchUp in debug mode.
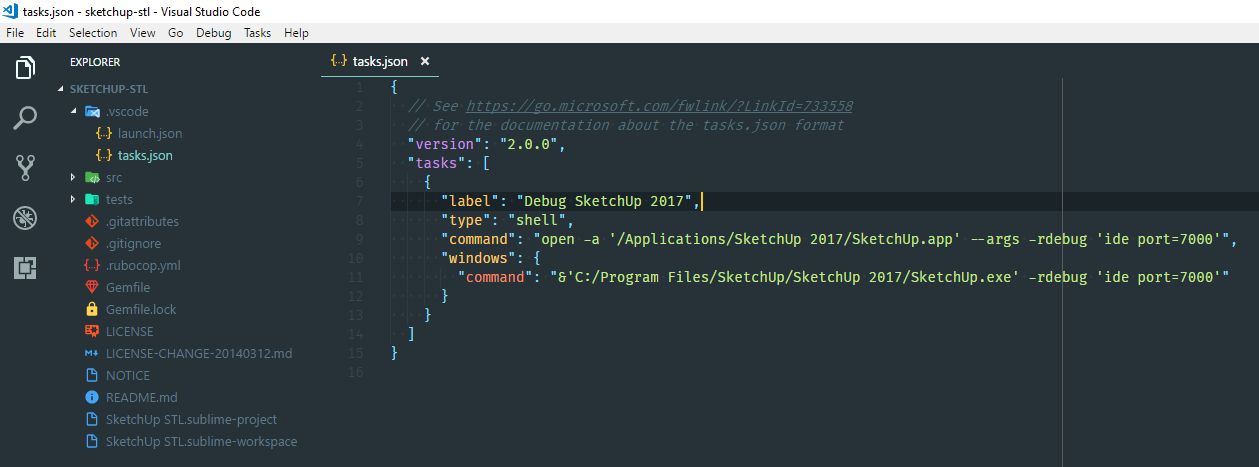
{
  // See https://go.microsoft.com/fwlink/?LinkId=733558
  // for the documentation about the tasks.json format
  "version": "2.0.0",
  "tasks": [
    {
      "label": "Debug SketchUp 2017",
      "type": "shell",
      "command": "open -a '/Applications/SketchUp 2017/SketchUp.app' --args -rdebug 'ide port=7000'",
      "windows": {
        "command": "&'C:/Program Files/SketchUp/SketchUp 2017/SketchUp.exe' -rdebug 'ide port=7000'"
      }
    }
  ]
}
You can more tasks if you need to test with multiple SketchUp versions.
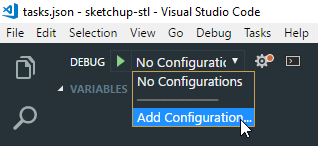
Now we configure the debug configuration for the project. Open the Debug tab in VSCode:

Add a configuration;
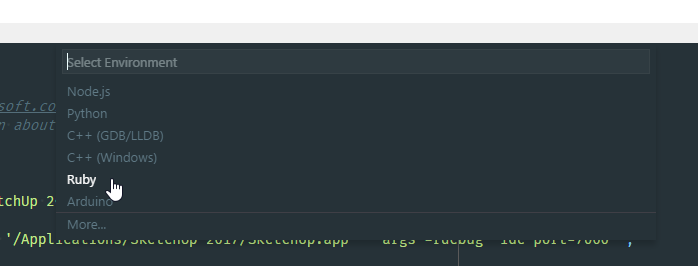
And pick the Ruby preset.
Replace the content with the following:

{
  // Use IntelliSense to learn about possible attributes.
  // Hover to view descriptions of existing attributes.
  // For more information, visit: https://go.microsoft.com/fwlink/?linkid=830387
  "version": "0.2.0",
  "configurations": [
    {
      "name": "Listen for rdebug-ide",
      "type": "Ruby",
      "request": "attach",
      "cwd": "${workspaceRoot}",
      "remoteHost": "127.0.0.1",
      "remotePort": "7000",
      "remoteWorkspaceRoot": "${workspaceRoot}"
    }
  ]
}
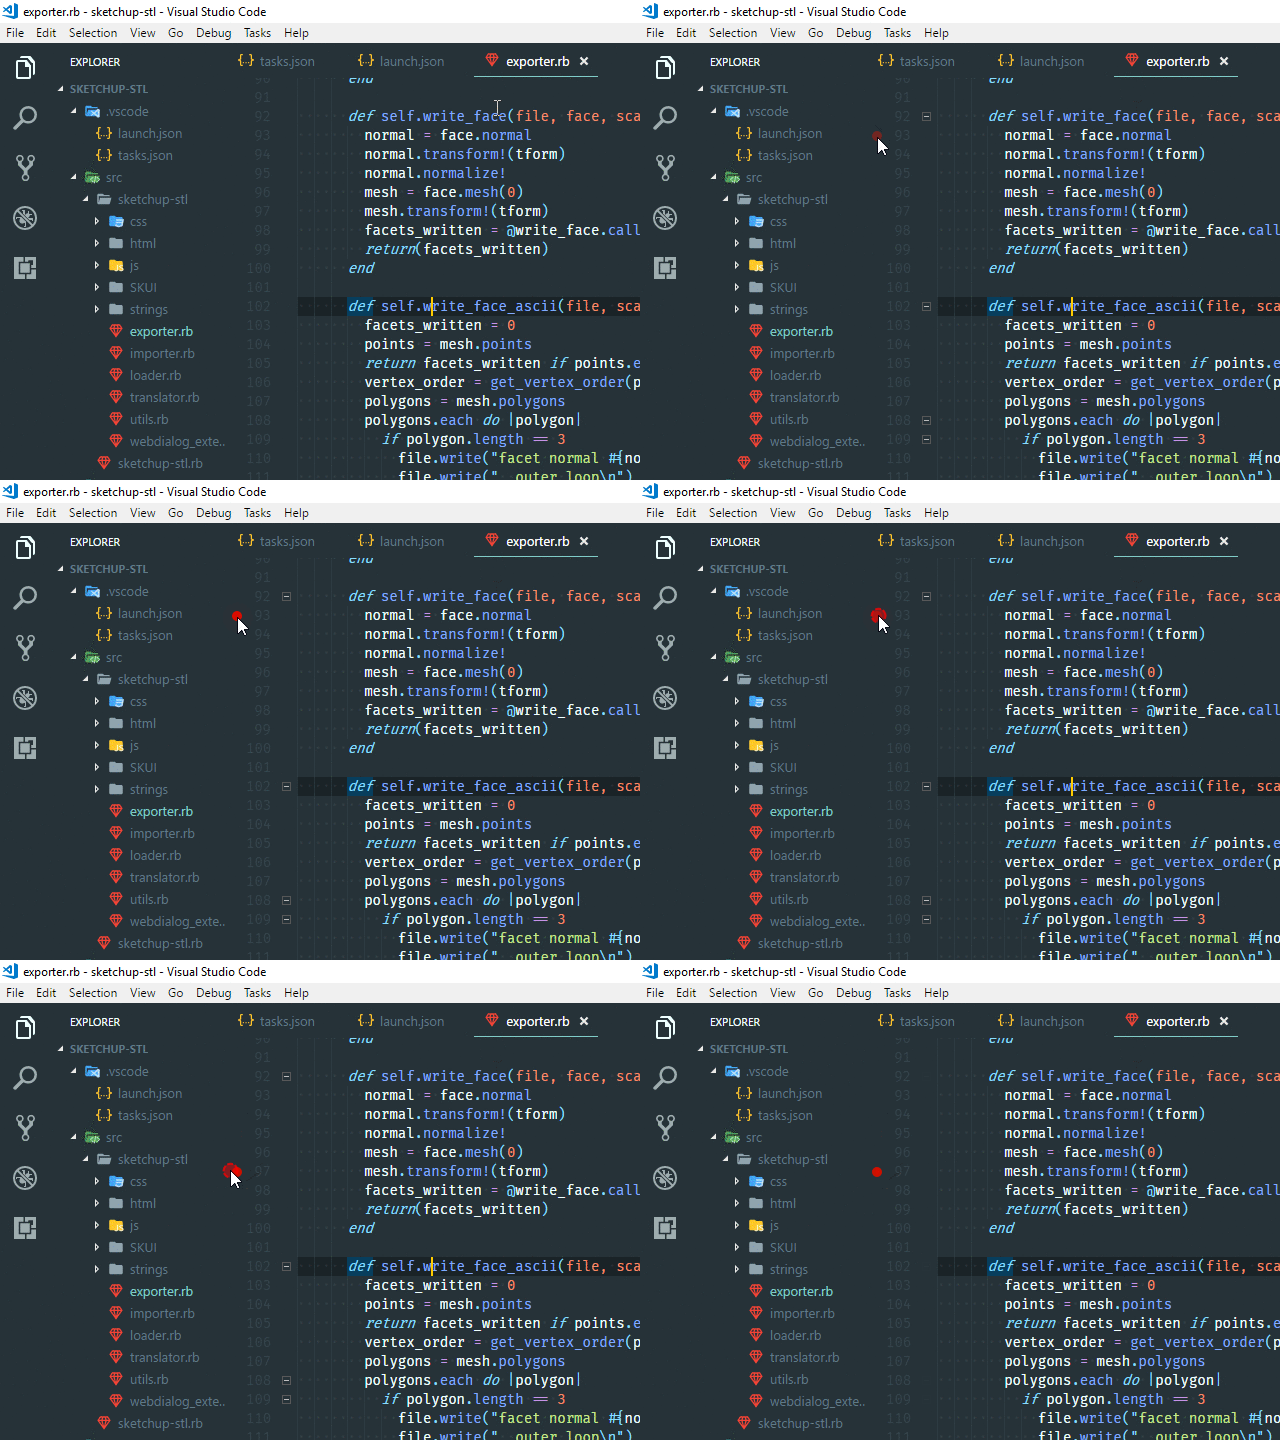
Now you are ready to start debugging. Add breakpoints by clicking in the gutter of Code, left of the line numbers.
Launch SketchUp by triggering the task; Tasks > Run Task...

Pick the Debug SketchUp 2017 task. If you are asked to scan the output, pick Continue without scanning the build output..
SketchUp should now launch. Once it's done loading, activate the debugger from Code:
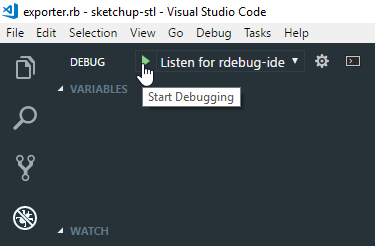
Return to SketchUp and use your extension. When the lines, where you set the breakpoints, are executed it will halt SketchUp. From there you can inspect variables and step through your code.
