-
Notifications
You must be signed in to change notification settings - Fork 9
Monitoring Cassandra
✅ Step 1: Monitor your system
K8ssandra takes monitoring and observability very seriously and provides us with built-in Grafana and Prometheus (but of course you can use external - batteries are included but swappable).
For Local and Civo installs: setup port forwarding with the following command
kubectl port-forward svc/k8ssandra-grafana 9191:80 &
kubectl port-forward svc/prometheus-operated 9292:9090 &
kubectl port-forward svc/k8ssandra-reaper-reaper-service 9393:8080 &
To find the UI for Grafana and Prometheus use the links page in your instance and click on the corresponding Grafana and Prometheus.
For Local and Civo installs: Use the links for Prometheus: http://127.0.0.1:9292 and
Grafana: http://127.0.0.1:9191
For
Datastax provided VMs: Use the links (NOTE: The trailing slash is required)<YOURADDRESS>:8080/prometheus/ and <YOURADDRESS>:8080/grafana/ respectively. .
For Prometheus, From the Status menu, choose Targets. Verify that the stargate/0 and k8ssandra/0 are in the state UP:
For Grafana the credentials are:
username: admin
password: admin
(Note: If you wanted to retrieve the values using kubectl, you could have used the commands below)
helm show values k8ssandra/k8ssandra | grep "adminUser"
helm show values k8ssandra/k8ssandra | grep "adminPassword"
Click the home button indicated by the arrow:
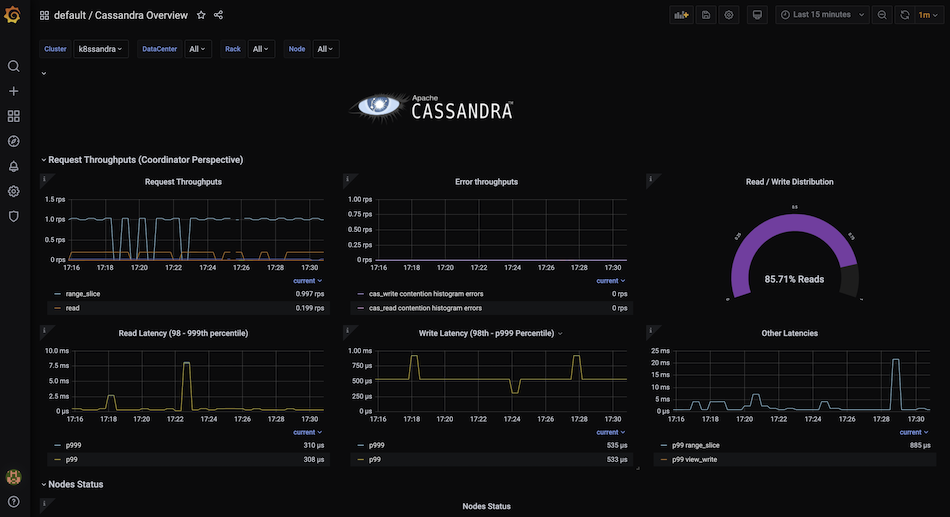
and the Cassandra Overview dashboard to see the dashboard as below.

Locate the panel on the left and pick Dashboard > Manage. Then click the ellipsis to show the available dashboards
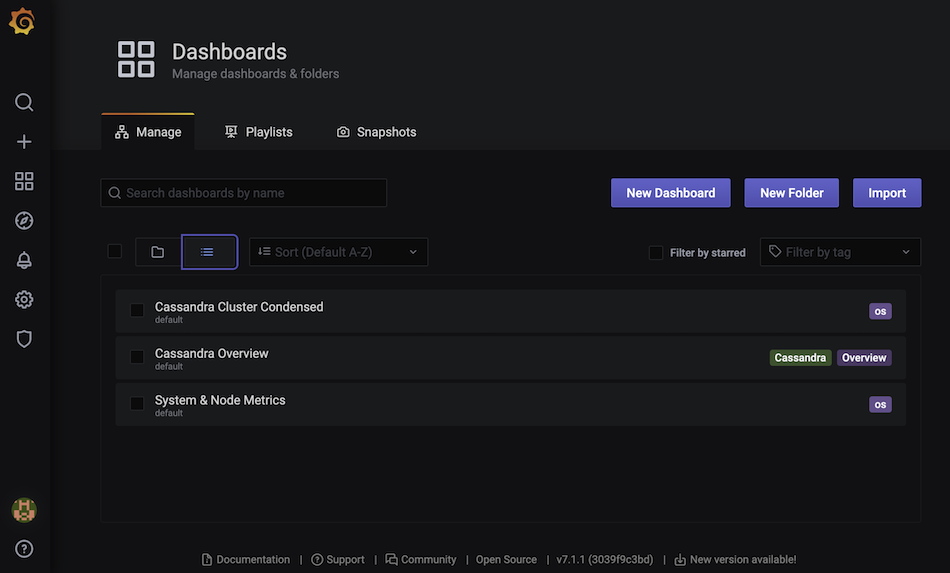
Cassandra Overview
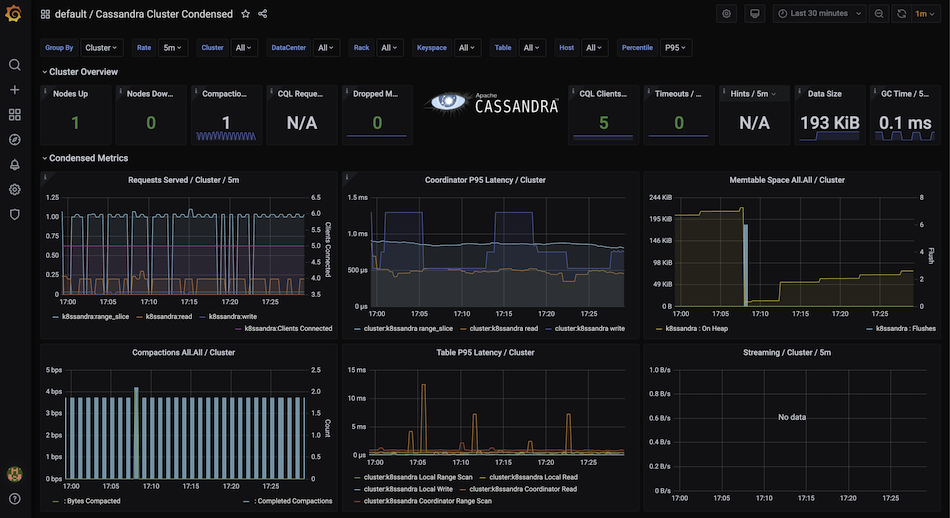
Cassandra Cluster Condenses
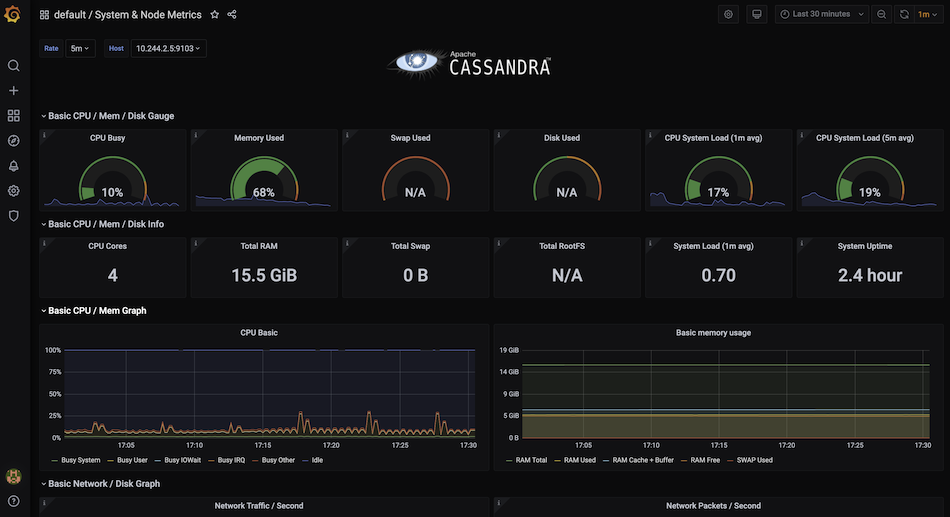
Cassandra Node Metrics
Proceed to the Step III
Got questions? Ask us using discord chat or a community forum!


