This curriculum introduces the fundamental steps of the product development process from brainstorming to growing your user base.
Written and developed by Kimberly Hou, George Liu, and Joshua Zweig.
For the first three levels of the curriculum, we will finish each day with deliverables for everyone’s individual project ideas. Since we will also cover parts of the process after the prototype has been built, we’ve included a sample project to use for activities on the fourth day.
A lot of discussion, sticky notes, and Googling go into building a product long before the product is actually built. Below we’ll introduce a few separate ideas that come together when researching the problem and the space in which we’re building a product.
After today, we’ll each have a product idea with a rough business model sketched out using the Lean Canvas. In the next level, we’ll design features and corresponding methods of implementation based on the business model.
While software companies might define their product development cycles differently, there are generally three main steps involved:
- Planning -- Based on the company’s missions and values, market research, competitor landscape, and user needs, let’s identify the specific problem and how to solve it
- Design -- Drawing from current user pain points for other competing products, let’s create a refreshing and enriching user experience that matches with our product’s value proposition
- Implementation -- We build out the product according to our plans and re-prioritize adjustments as a larger scale of user feedback rolls in
In today’s part of the curriculum, we’ll take a look at various ways research is conducted as part of the planning stage. Throughout, we’ll apply some of what we learn in a case study of Snapchat, one of today’s hottest consumer apps.
Market validation is the process of gauging your target market’s interest in your product. If you can hypothetically sell it before you build it, you will have saved yourself a lot of time from spending hours on a product users are not interested in it.
Before building a product, it’s important to define who your users/customers are to make sure what you create would be relevant to your audience. A few questions to consider:
- What is the problem we’re trying to solve?
- Who are the users and customers? Customers won’t always be the same as your users.
- What would the target market be willing to pay / how can the product be profitable?
- Who would our competitors be, and what are their strengths / weaknesses?
What problem does Snapchat design a solution for?
- "Snapchat isn't about capturing the traditional Kodak moment. It's about communicating with the full range of human emotion — not just what appears to be pretty or perfect."
- "Emergency detagging of Facebook photos before job interviews and photoshopping blemishes out of candid shots before they hit the internet" [source]
Who are the users?
- Criteria for being a snapchat user: Having a connected smartphone (indicates a certain geographical/socioeconomic status)
- Key demographic: US Residents, 13-24 years of age
- Snapchat is still young, so US Residents from 13-24 are the key demographic thus far, but international and older demographics are beginning to adopt the technology
Let’s switch gears for a bit and introduce what many companies (both large and small) are now seeing as crucial to the product development process even from very early on: user feedback.
User tests are the bread and butter of figuring out how to build and improve your product. Ideally, a company would be talking to its potential users throughout the product development process and making slight adjustments along the way to maximize efficiency and reduce wasted resources.
When conducting one-on-one user tests and observing how people first interact with the product’s user flow, it’s important to think about what they do not say, as well as what they comment on. Identifying usability problems is not always straightforward. For example, a user may not be able to find the login button on a site for about 5 seconds; the user might not say anything for fear of sounding dumb, but that would be an indicator important usability issue that the team should re-evaluate.
How many user studies is many? Feedback sessions can be costly in terms of time for the team and money for the users. As a rule of thumb, some say you’ll find the significant problems with your product from just 5 user tests for every iteration.
Another option is to conduct focus groups, where several people are brought in to be interviewed as a group to answer questions. These tend to be useful for sourcing keyword ideas on branding, mission, and marketing, as well as for suggestions on the product’s overall user flow.
When choosing a sample of the product’s target audience to conduct user feedback tests with, companies often first write screeners. A screener could be as simple as a form to select users of the correct target demographic. It’s very important to erase any potential biases in how each question on the screener is worded to avoid false answers.
A few things to keep in mind for writing effective screeners:
- Use multiple choice questions with answer choices as ranges when possible
- Masks the demographic that the tester is looking for, giving users no reason to lie
- Always add a choice for “I do not feel comfortable answering this question”
- Especially important when asking for more sensitive information such as credit score or salary ranges
- Gives users sense of privacy
The term ‘business model’ is sometimes taken as the answer to ‘how a company makes money,’ but it can be so much more complex and flexible than just that. In fact, ‘business model’ has been referred to as a ‘term of art.’
In a nutshell, a business model explains what user problem you’re solving, what your product’s value proposition is, and what profitability margins could realistically look like.
- Warby Parker
- E-commerce site that sells glasses more inexpensively than competition by removing the middlemen
- Donates money for every pair sold to nonprofit partners to fund sourcing of glasses and training of optometrists in developing countries
- Fruit Ninja
- App built on a freemium model (free downloads with options to purchase extra features or bigger subscriptions) that uses ads to support its free version
- Premium downloads + in-game purchases are over $1 million / month, in addition to advertisting revenue
- Airbnb
- Takes advantage of the person-to-person business model
Now let's take a look at Snapchat, a rather interesting case:
- It is not uncommon for tech companies that deliver a viral/niche product to begin without a business model
- Sponsored Channels (Discover) - Companies pay to have their sponsored content on a snapchat channel (news, sports, fashion, etc) and users receive well-curated and frequently updated content
In order to consolidate and document a given business model, Alexander Osterwalder proposed the Business Model Canvas in 2008, allowing teams to segment out the fundamentals of operating their business, from identifying key partners to building customer relationships. Other versions of the tool have stemmed from the Business Model Canvas, including the Lean Canvas for startups, which was created by Ash Maurya. It was made with the mindset of the Lean Startup methodology as developed by Eric Ries in 2008. The method emphasizes user feedback during the entire product cycle so as to save as much time and energy as possible while optimizing a solution users want. Instead of waiting until launch to speak with users and gauge interest, Ries calls for building a minimum viable product (MVP) instead as soon as possible and then iterating upon it based on user feedback.
We’ll be using the Lean Canvas template in this curriculum to brainstorm and define our own business models.
Today's Deliverable: Think about a problem that you’re interested in or passionate about. If needed, conduct some research about the space you’re hypothetically pursuing and form a framework from which to implement your solution. Document your own business model using the Lean Canvas template.
Hooray! We now have our proposed business model. When thinking about the user interface and experience of our product, we will be using a philosophy known as user-centered design (UCD). The UCD process is focused on understanding the needs, wants, and limitations of end users, in order to optimize the product around user behavior, as opposed to expecting users to adapt to the product. Before we lay out any plans for our product’s visuals, let’s take a look at a few techniques that product managers use to convey the specifics of the implementation to designers, engineers, and other involved team members.
When talking with product managers, you might hear them talk about specs, which they’re often in charge of writing. Spec -- short for specification -- refers to the document that describes the the high-level purpose and vision of the product all the way down to the nitty gritty details of the features and how those features are implemented.
There is no standardized way across companies to write specs, but they generally have the same fundamental elements:
- Version of the product
- Purpose and vision of the product
- How users can interact with the product (as organized by user stories or simply by feature, e.g. Search Box)
Note that for bigger projects, common at larger companies, specs can also be written for individual features of a much larger product.
Often, specs are put together by starting with user stories. A user story describes a specific use case of a specific feature. These user stories are commonly written using the following template:
As a , I can so that .
A few examples of what user stories might look like: TI-84 Calculator -- As a high school student, I can draw graphs using the calculator so that I can make data visualizations in math classes. GroupMe -- As a user, I can ‘favorite’ a message in a conversation in order to increase the opportunities for social interactions. FaceTime -- As an iPhone 6S user, I can view my FaceTime call history.
From these general user stories, more detailed and specific user stories are created to implement a solution for every possibility of every feature’s use case.
For reference, below is a link to a sample feature spec from Mozilla for category pages in their Firefox web browser product:
https://docs.google.com/document/d/1VzNPatym-iyd2aJNsWlvsNGjb3MZEacEvKpfouV3VGw/edit
As part of optimizing user experience for a product, some designers emphasize the importance of developing personas. Personas are different user types resulting from defined segmentation of users who may be interacting with your product, based on research and feedback. Not all designers like to create personas, though, and some prefer to rely strictly on iterative techniques like A/B testing for understanding user preferences and making design decisions. If you choose to develop personas for your product, keep in mind the characteristics of each must be rooted in data to prevent them from becoming mere stereotypes.
Personas can also be used for branding and marketing purposes, beyond their application in user-centered design. For instance, CityMapper capitalizes on the stereotypes of its users as part of marketing -
User flows visualize the user’s path from start to finish, documenting how the user interacts with your product and completes the funnel. The funnel in this case refers to a multi-step task (whether filling out a registration form or answering a survey, etc.) that your user would ideally complete. Obviously, many people who start the process many drop out over the course of the process for various reasons (thus creating a decreasing funnel shape). Those who do complete the entire process are referred to as conversions.
Before creating user flows, it’s important to clearly define your product’s goals (e.g. getting a visitor to sign up) and your user’s goals (what the user would desire or need). Think about how you can create each step of the way as something a user would want to do.
Also, remember that the users may come upon your site / product through various sources; examples include paid ads, organic search, and direct links to your site. Will they be directed to a landing page based on where they came from and the wording of your ads? The user flow is often different dependent on the channel through which the user arrived.
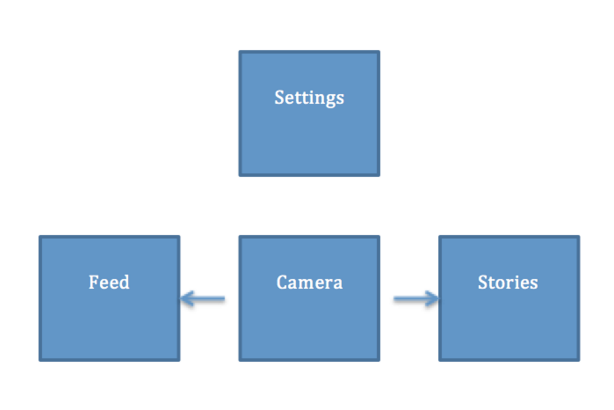
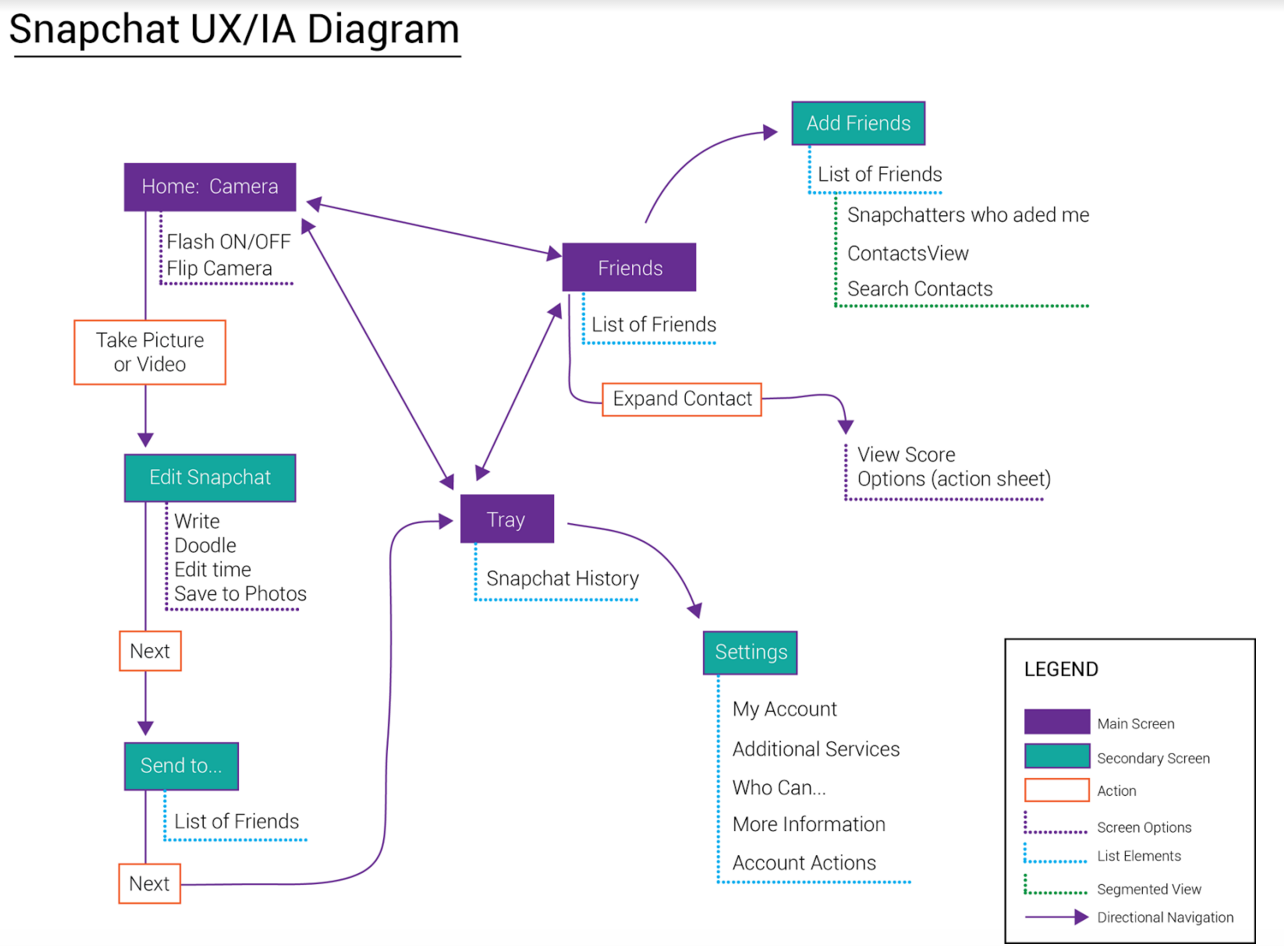
The most common user flow in Snapchat (sending a snap) is abstracted to take a minimal number of input/keystrokes from the user, with a total of 3 steps (read down the right hand column of the figure). Going back to the mission statement: the user flow is optimized for people to take and share photos that capture their unabridged emotion and state. This is why the home screen on first launch of the app is the camera. The camera is the focus of the user interface.
The way to think about your metrics is by thinking about what questions you want to ask yourself about how your users are using your product. Snapchat might be interested in the following questions about how their users are using the app:
- Is there a drop off point/bottleneck where users are stopping in the flow of sending a snap?
- Putting counts in about how many users are at each point in the flow could give insight into this
- This could help snapchat identify if there is a painpoint/bottleneck in the app flow
- How many friends does the average user have?
- Gives insight into the userbase
- Could be an interesting KPI for engagement and possible investors
- How many daily active users does snapchat have?
- KPI common in the industry
- How many snaps do users send?
- Could be important in properly allocating servers
- Where is Snapchat being used?
- Again important in where to place data centers
- What demographic of people is using our app?
- It is crucial to KNOW WHO YOUR USERS ARE
- When building and revising a product, you must know who you are building it for
- Are people returning to the app?
- Another interesting KPI
- Could identify other possible bottlenecks
Deliverable: Create a spec for your product. Tomorrow you’ll be using it to design your mocks!
For this project, we’ll use the following process to design our product:
wireframe → mockup → prototype
Note that the design process of a product can vary widely by company. Some companies don’t do a wireframe at all, or they complete the process in a different order. Some might also emphasize perfection and adherence to a mockup more than others. Yet others define prototypes differently.
As we dive into the more design-oriented phase of product development, there are a few things to keep in mind:
- Simplicity is key
- Keep your call to actions focused to keep the user going down the funnel
- Wireframes are for structure; mockups are for visuals
First, make sure you have Balsamiq downloaded. We’ll be using the free trial version, which is valid for 30 days.
Before fleshing out colors and other visual details, we will first make a wireframe. Typically of low fidelity, a wireframe is mainly used early on in the process to map out the structure of elements on the page(s).
Deliverable: Using Balsamiq (or pens and paper if you’d prefer), create a wireframe based on your specs.
Wireframes are cool to get a sense for the user interface; now let’s bring the product to life by creating a mockup! We’ll use the free trial of Axure.
Axure has a few awesome tutorials; take a look at the first 5 or so to become familiar with the layout of the software.
Deliverable: Using Axure, create a mock based on your wireframe.
At this point, we’re ready to create a prototype of what we’ve planned out. If you’re ready to go ahead and code up what you’ve planned thus far, by all means jump in. Alternatively, we’ve included a sample project you may use to continue with the rest of the tasks in the curriculum.
We’ll use a sample website as a coded prototype that you can download from this Github repository. Let’s see how many people are clicking on our buttons and scrolling through the webpage. This is also known as tracking user engagement and/or user conversions. In this level, we’ll learn about implementing event tracking through Google Tag Manager and Mixpanel.
Google Tag Manager (GTM) is a free software tool to remotely deploy code on your site that allows for event tracking (and much more) without having to directly hardcode every single page of your site. An event is simply an action by the user, whether it be clicking a button or viewing a page. In Google Tag Manager, we create a trigger for each event by setting customized rules. If these rules are met, the trigger is turned on and tells the corresponding tag to ‘fire,’ sending the information through the Google data layer object to another software tool that specializes in tracking the actual analytics.
Hold up, what is the Google data layer? The data layer is an object in which information such as events or variables we define is passed to Google Tag Manager. We can then create triggers based on these variables.
So what analytics tool would go well with GTM? There are several great options out there to pair with Google Tag Manager such as Google Analytics or KISSmetrics. For the purposes for this project, we’ll use a service called Mixpanel because of its ability to track analytics more or less in real time.
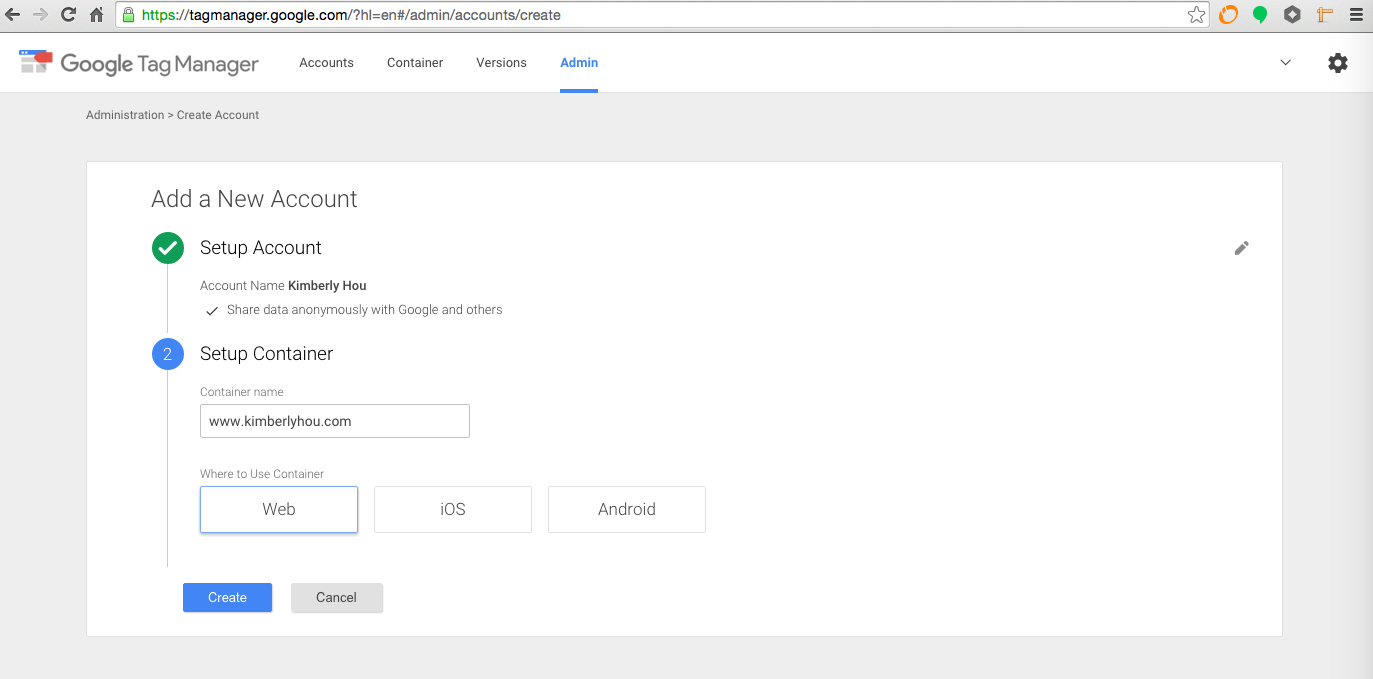
Sign into GTM and create an account with the setup container as the domain you’re using:
Then copy the code as prompted and paste into every page of your site right after the opening <body> tag.
Google should also initiate a data layer object automatically, but just so we can visualize it better, let’s add the object above the container snippet:
...
<body id="page-top">
  <script>
  dataLayer = [];
</script>

<!-- Google Tag Manager -->
<noscript><iframe src="//www.googletagmanager.com/ns.html?id=GTM-MRTDS4"
height="0" width="0" style="display:none;visibility:hidden"></iframe></noscript>
<script>(function(w,d,s,l,i){w[l]=w[l]||[];w[l].push({'gtm.start':
new Date().getTime(),event:'gtm.js'});var f=d.getElementsByTagName(s)[0],
j=d.createElement(s),dl=l!='dataLayer'?'&l='+l:'';j.async=true;j.src=
'//www.googletagmanager.com/gtm.js?id='+i+dl;f.parentNode.insertBefore(j,f);
})(window,document,'script','dataLayer','GTM-MRTDS4');</script>
<!-- End Google Tag Manager -->
...Let’s pause using GTM for a minute and navigate to our HTML file. In order to link the HTML elements we want to track -- in this case, we’ll start by tracking button clicks -- we need to add events in Javascript to push certain data when those buttons are clicked. To do so, add the following code snippet to your first button:
...
<a href="#section-one" onclick="dataLayer.push({'event': 'startButtonClicked'});" class="btn btn-primary btn-xl page-scroll">Start the journey</a>
...
Note that you can customize the field where ‘startButtonClicked’ is. You’re essentially naming the event that your trigger will look for in the data layer when that particular button is clicked.
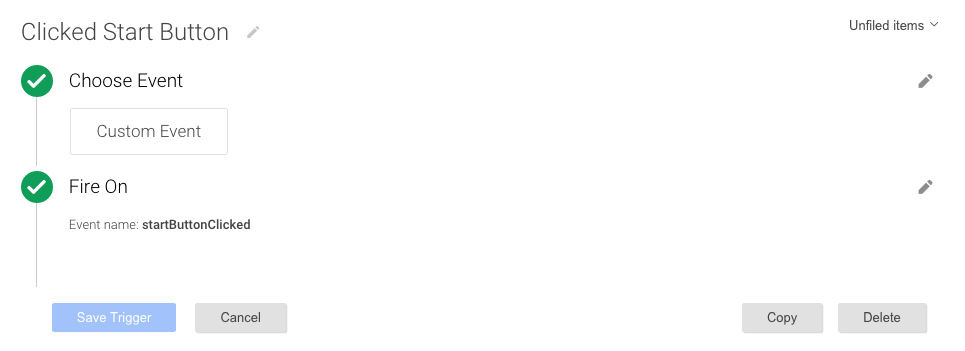
Now let’s add a corresponding trigger in GTM to track this particular button click:
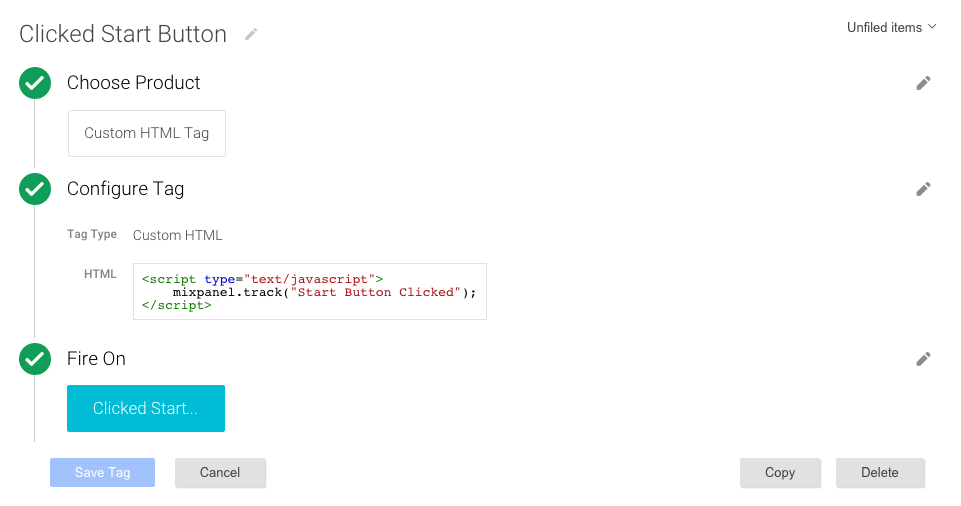
Now that we’ve set up the rules to make this trigger render as true or false, we need to set up a tag that will fire when this trigger renders as true. Let’s create a tag with these settings:
The string that is passed into mixpanel.track() will be the string you will see directly in Mixpanel’s analytics view when you log in. It will only fire on the specified trigger.
Now that we’ve added both a tag and trigger for an event, let’s add the rest of the event handlers in our HTML document for the rest of the button clicks we’d like to track as well as their corresponding tags and triggers.
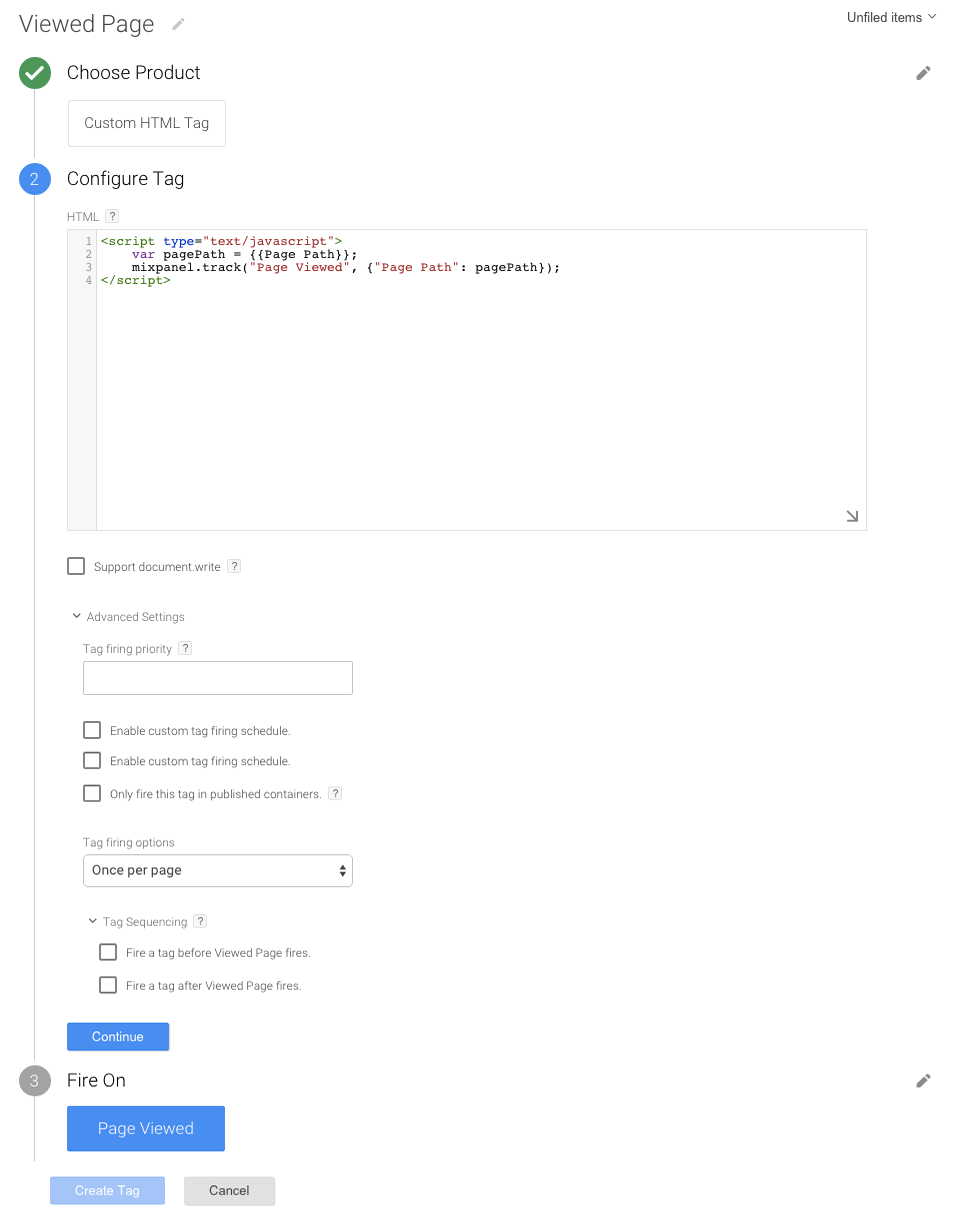
We can also track page views for our site. To do so, let’s create the following tag:
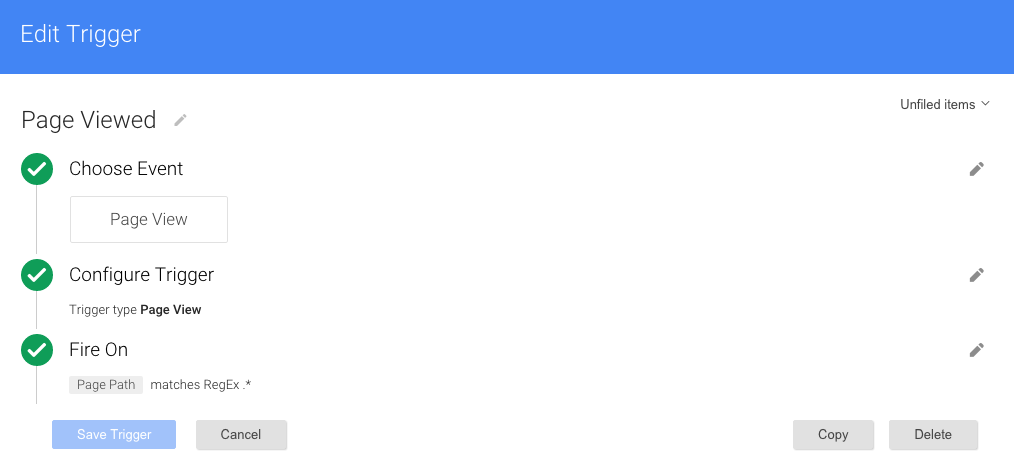
This tag should have the attached trigger:
Note we’re using a variable in this case to draw the particular Page Path passed through the data layer object. We’re then capturing that piece of information and sending it to Mixpanel as we’ll see shortly.
For more information about the data layer, GTM’s developer guide is a good reference.
Create a free account and copy the code snippet as prompted. However, instead of pasting it directly onto the web page, we’ll create a single Tag in GTM to have the snippet load on every page.
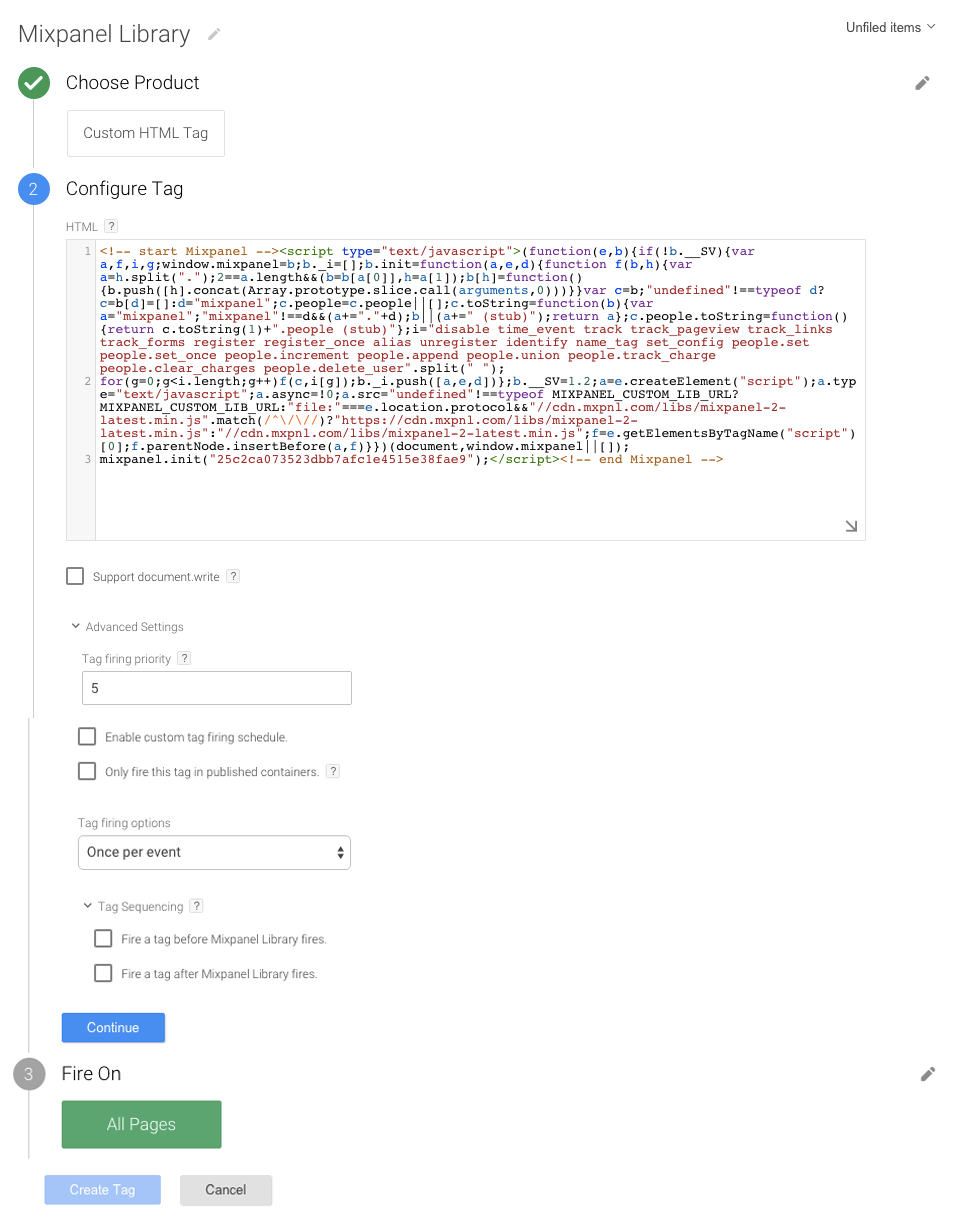
Let’s hop on over to GTM and make a tag with the following settings:
Make sure that the priority of this tag is set to 5 (or anything higher than the default 0) so that it will load first before any other tags.
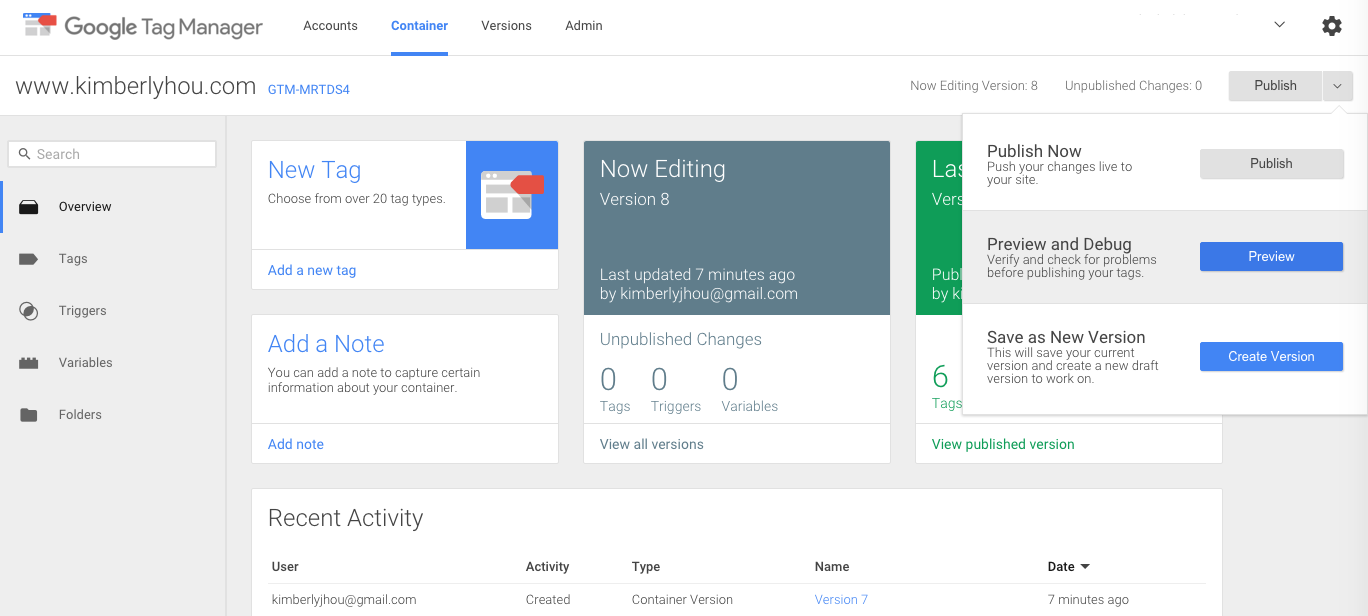
We’re almost ready to finalize everything! As these parts come together, there is a useful tool we can use in Google Tag Manager to preview the tags and triggers we’ve created live before (or after) publishing all changes.
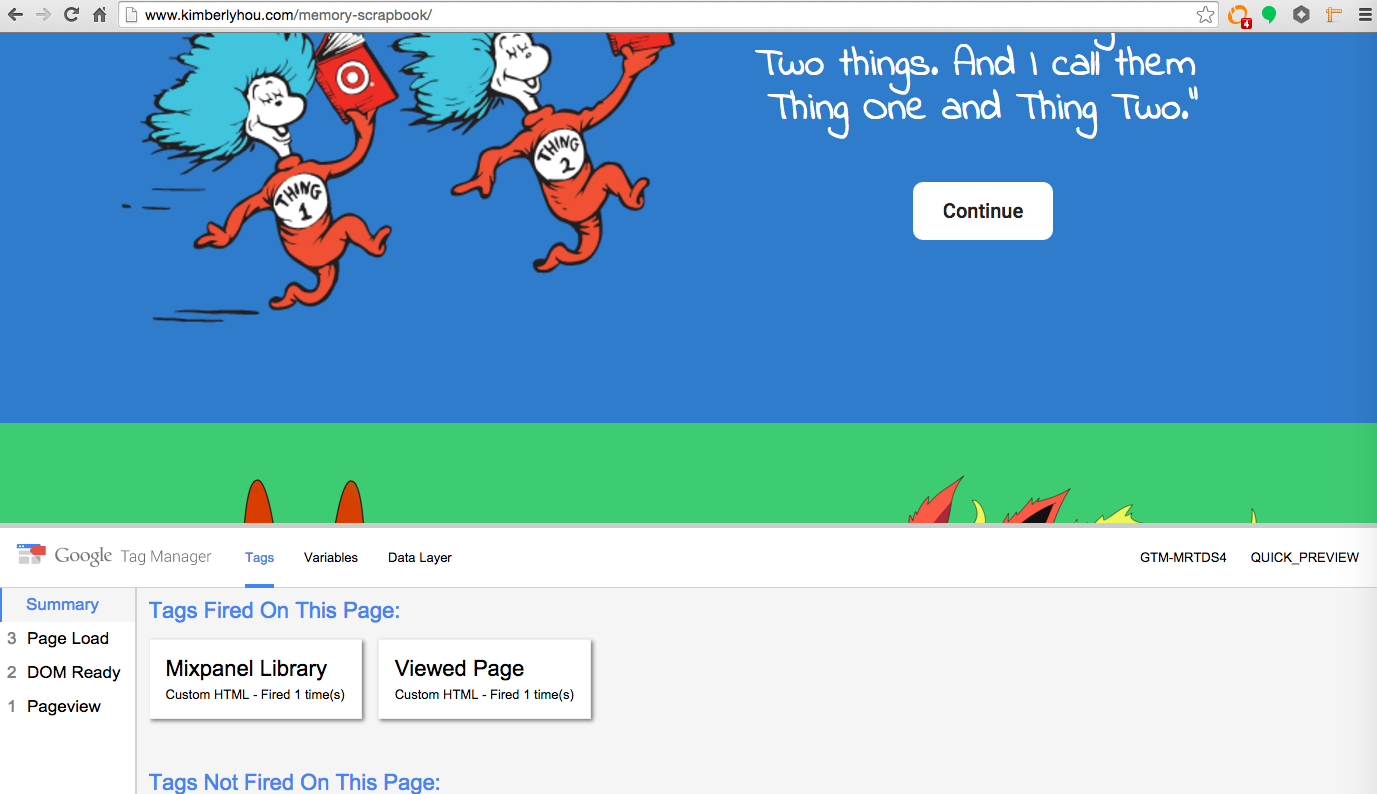
Let’s open up GTM, change our mode to Preview, and then open up our website in a new tab of the same browser.
Right away, notice the Mixpanel Library tag is automatically fired once the page loads:
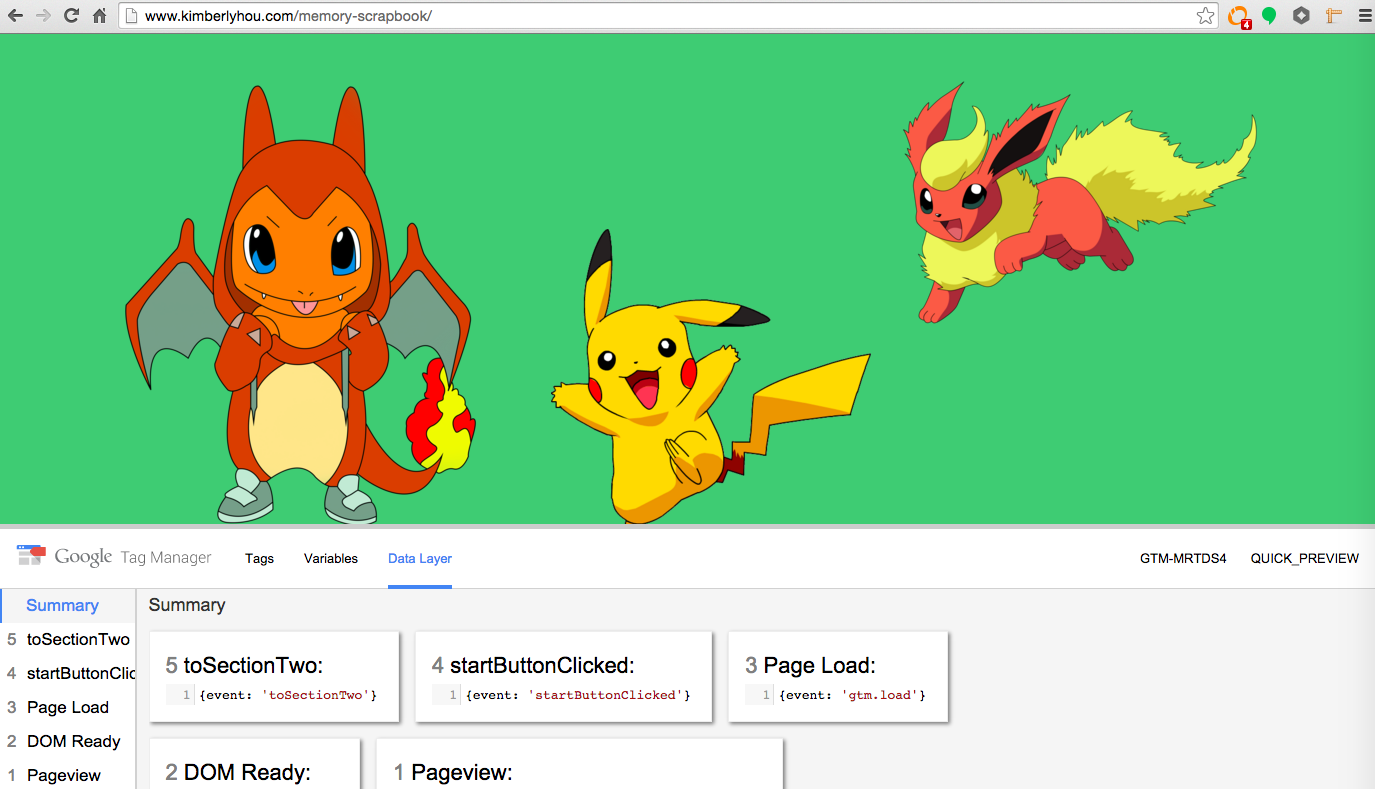
After clicking on the first two buttons of the page, you should see additional tags be fired as well as the following events pop up on the data layer:
If these look good to you, go ahead and publish any/all changes on Google Tag Manager.
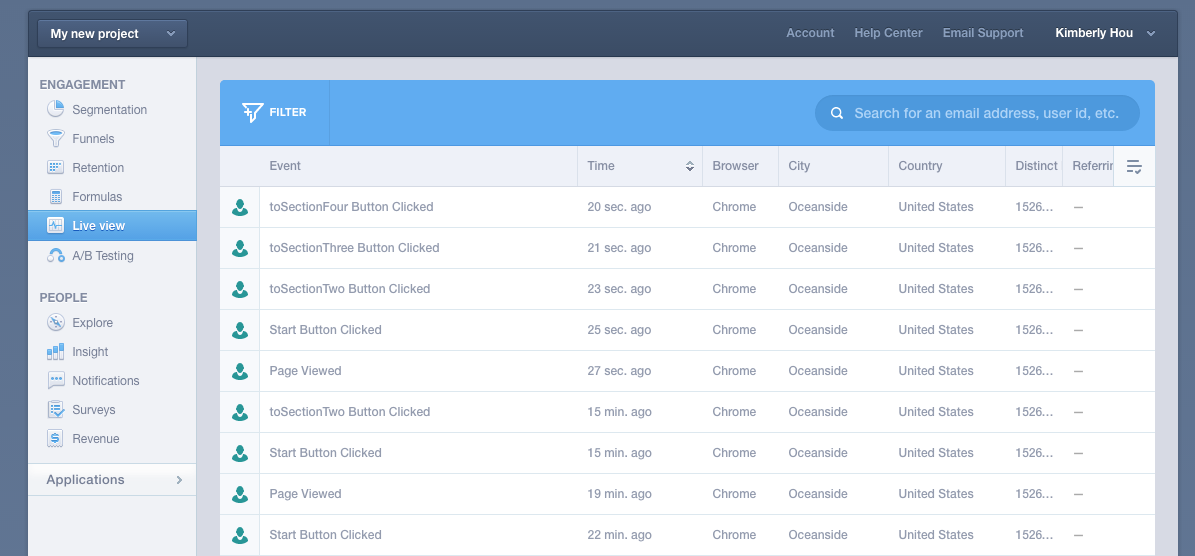
Login to your Mixpanel account and navigate to the Live View tab. If the above steps have worked for you, you should now be seeing live click events you’re tracking come through!
If you’ve implemented the page view tracker with your own page path variable, here is what you should also see when you click on the event in Mixpanel:
There are tons of features to both Google Tag Manager and Mixpanel that we haven’t explored. What we’ve looked at merely scratches the surface of these tools’ potentials, especially with the inherent limitations of the simple site we’ve made. That being said, it’s also cool to visualize how users are engaging with your site through tracking your own funnels, which you can also make in Mixpanel as well.
Growth needs to be prioritized at every stage of your product for it to succeed. The assumption that “good products sell themselves” has never been more false. Conceptually and in a vacuum, this statement seems logical. However, in the cutthroat reality of a world saturated with countless products competing for every consumer/organization’s attention span each day, it is difficult for good products to even get thought of by their consumers, much less get used.
In fact, even if a product is good and has huge factors in its favor, such as a large existing user base, significant funding, or first-mover advantage, it’ll still probably fail. Just look at products such as Rdio, Sidecar, Secret, Google+, Everpix, Slingshot, and countless other products now in the graveyard. Now more than ever, growth principles need to be instilled in the product for it to even have a chance of survival.
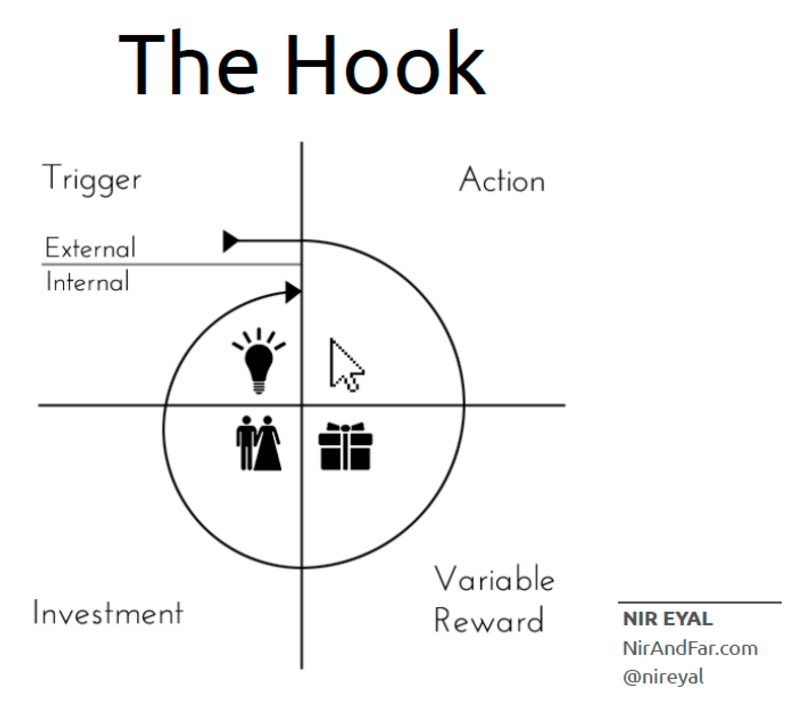
The Hook Model -- When creating your product, your ultimate goal should be to turn your product into a habit. Use Nir Eyal’s Hook Model to dissect a user’s flow throughout your product and determine which areas to improve. The hook model is a cycle comprised of four parts: trigger, action, variable reward, and investment.
What’s your product’s trigger? -- A trigger sparks the beginning of a user’s behavior in your app. There are two types of triggers, external and internal. An external trigger is something that the user sees and one that alerts users to come to the product; examples include an email, link, or the app icon. An Internal trigger is something the user thinks or feels and attaches itself to a user’s existing behaviors. This attachment done through the user cycling through the Hook Model multiple times. When a product becomes tightly coupled with a thought, an emotion, or a preexisting routine, it leverages an internal trigger. Probably the best example of an internal trigger is your itch to check your Facebook newsfeed every day if you’re bored.
What’s your product’s action? -- An action is the minimum interaction the user needs to do to get a reward (next step). It follows the trigger. In deciding what action the user should take, use the Fogg Behavior Model as a reference. The Fogg Behavior Model states that there are three core motivators required to initiate any and all behaviors:
- Seek pleasure and avoid pain
- Seek hope and avoid fear
- Seek social acceptance and avoid rejection
In addition to this model, take into account various mental heuristics all humans have. The most relevant ones include: The scarcity effect: the appearance of scarcity affects perception of value The framing effect: context also shapes perception and the mind takes shortcuts informed by our surroundings to make quick and sometimes erroneous judgment Anchoring effect: people often anchor to one piece of info when making a decision Endowed progress effect: a phenomenon that increases motivation as people believe they are nearing a goal
Finally, the user should also have the ability to complete the desired action with the greatest amount of ease possible. Any tech/product that significantly reduces steps to complete a task will enjoy high adoption rates by people it assists.
What’s your product’s variable reward? -- Levels of dopamine surge when the brain is expecting a reward and there is very little diminishing marginal effectiveness when the reward has different content every time. Moreover, introducing variability multiplies the effect, creating a focused state, which suppresses the areas of the brain associated with judgment and reason while activating parts associated with desire.
Variable rewards come in three types: the reward of the tribe, the reward of the hunt, and the reward of the self.
- The tribe: the need to feel accepted and important
- The hunt: the need to acquire a prize
- The self: the need to better oneself
What investment does your product ask from the user? Investment is the last phase of the Hook Model and it focuses on increasing the odds the user will make another pass through the Hook Model. Remember, the more cycles a user makes through your product, the stickier it becomes and the more it becomes associated with an internal trigger.
An investment occurs when the user puts something into the product such as time, data, effort, social capital, or money. Moreover, an investment needs to imply an action that improves the service for the next go-around. Examples include inviting friends, stating preferences, building virtual assets, and learning to use new features are also investments.
Okay great. Now you have a conceptual framework to build growth into your product. Now how do you measure its effectiveness and iterate on this MVP?
The hooked model is a great conceptual framework to keep in mind throughout all stages of a product’s lifecycle, but after the minimum viable product is created and pushed out to your target audience, you also need a framework to digest usage data and create experiments.
Experimentation process -- Here is the process used by the HubSpot growth team. This framework is a sustainable growth process that is scalable, repeatable, and somewhat predictable in trying out and optimizing user growth channels.
The first step is to know where you’re going and set goals with an OKR framework (Objective and Key Results). OBJECTIVE: Qualitative statement. Take a step back and ask what is the one area you can work on that drives the biggest impact on your growth curve right now? TIMEFRAME: 30 - 90 Days
- KR1: Measurable Goal 1 (Hit 90% Of Time)
- KR2: Measurable Goal 2 (Hit 50% Of Time)
- KR3: Measurable Goal 3 (Hit 10% Of Time) One of the biggest mistakes almost all startups do is trying everything at once instead of prioritizing; this OKR helps prevent this. There’s tremendous risk to diversifying growth channels too early: you stretch thin already limited resources and end up doing so many things at once the results come back extremely slow and you get nowhere for a long time. Instead, it’s much better to prioritize and choose one or two channels at a time to test out. If they don’t work, take the learnings, which give you a much better sense of the next one or two channels to move on to, and move on to these channels. Even in the longterm, a lot of successful companies scale off the back of one major acquisition channel (can account for 80% of a company’s growth).
The second step is to hit the road as fast as possible after setting OKRs. This process is comprised of brainstorming, testing, implementing, analyzing, and systemizing.
Brainstorm -- There are four ways to generate growth ideas: observing, questioning, associating, and networking Observe: how are others doing it? Look outside of your immediate product space. Walk through together. Question: Why? What is... What if... What about... How do we do more of... Associate: connect the dots between unrelated things. Network: growth mastermind groups.
Prioritize -- Prioritize based on three main factors: probability of success, impact, resources. Do the low-resource things first because you should try to get as many experiments in as possible.
Test -- Create a minimum viable test and an experiment document detailing the test. A minimum viable test is the minimum thing you can do to test hypothesis. Afterwards, implement the test as fast as possible; remember that you want to get as many experiments in as possible.
Analyze -- This is the most important step of the process. Important areas of analysis include the impact of the test, the accuracy of the hypothesis, and why you believe the results of the experiment happened. As you extract as many learnings as you can, turn them into new action items, and adjust priorities and predictions accordingly
Systemize -- After analyzing, systemize your learnings by taking the successful learnings and feeding them back into the process. Integrate learnings as much as you can into the product itself and for the things you can’t productize, build into step by step playbooks to make them repeatable.
Throughout this process, you should have created five key documents.
- OKR
- Backlog: the backlog of experiment ideas.
- Pipeline Experiments: a ledger of experiments that were ran or are currently running and the highlights of their results.
- Experiment Doc: Include the Objective, Hypothesis, Experiment Design, Results, Analysis, and Learnings
- Playbooks: Step by step guides for successful experiments that should be repeated.
Take a step back -- Have review every quarter and look at your operations from a macro perspective. Consider issues such as
- What’s your batting average? How many successes to failures?
- Is it improving over time? Are your hypotheses getting more accurate?
- How many experiments are you running in a given time period? How do you do more?
- Afterwards, optimize accordingly by improving the team, the process, or the tools.
Since brainstorming is the hardest and most abstract component of this process, I’m going to expand on this. You can find and run ideas through the aforementioned Hook Model but now’s also a good time to introduce the AARRR framework (the growth funnel) popularized by 500 Startups, which helps you find ideas for which growth channels and metrics to focus on.
Acquisition -- People come to your site after they’ve heard about you through press, blogs, word of mouth, and other acquisition channels. There are two types of acquisition channels: inbound and outbound. Inbound acquisition channels focus on creating quality content that pulls people in. Example inbound channels include blogging, podcasting, ebooks, guides, whitepapers, infographics, webinars, conferences, videos, slide decks, SEO, and an organic social media presence. Outbound acquisition channels focus on pushing information to people in often disruptive ways. Examples of outbound marketing include billboards, television ads, social media ads, promotional swaps, and affiliate marketing.
Activation -- If people like what they see on your homepage or other landing page, they’ll become users by either creating an account, signing up for a newsletter, or some other form of activation. Activation methods include landing pages, copywriting, calls to action, onboarding, gamification, social proof.
Retention -- Users come back to the site through reminders and stay active through product features they encounter while they’re back on the site. Retention is the most important part of the funnel; it provides the foundation of growth and every improvement to retention also improves virality, the lifetime value of a customer, and payback period. To improve week one retention, get users to experience the core value of the product as quickly as possible using better onboarding, clearer messaging, and segmented NUX targeted at different users. Improving Week 1 retention is particularly important because it shifts the whole retention curve up. To improve mid-term retention, get users to create habits around the core value of the product (ie through the Hook Model). To improve long-term retention, get users to experience the core value as much as possible (ie through the Hook Model)
Referral -- Active users refer others through viral product features and other incentives. Social media sharing buttons, social logins, referral competition, referral rewards, pre-written emails, etc. are all ways to get people to recommend your product.
Revenue -- Eventually you’ll have to monetize active users through advertising, lead generation offers, subscription, or business development.
Deliverable: Brainstorm some of the mechanisms you’ll use to get people through each stage of the growth funnel.
Hope you found this curriculum helpful!
To learn more about our organization, visit CORE.

