-
Notifications
You must be signed in to change notification settings - Fork 1
Home
KnotFolio is a browser-based program for drawing and manipulating topological knots and links. To use it, all you need to do is go to https://kmill.github.io/knotfolio/ with a sufficiently recent web browser (it has been tested with Chrome and Firefox).
The program is organized in terms of toolboxes, which are editing modes that operate on specific formats of knot diagrams. Each editing operation is undoable via the undo interface:

The painting toolbox is the mode the program starts out in. One way to input a knot is to draw in the canvas area then click "Convert to diagram." Unlike other programs for drawing knots, this is just a paint program (no vector graphics!), which gives some flexibility.
Tools:
- Pencil. Clicking and dragging draws a line with the current pencil color. The pencil mode determines what happens when the line crosses a previously drawn line.
- Eraser. Draws a thick white line, which erases whatever is present. Shortcut: right click to erase.
Pencil modes:
- Go over. The drawn line has a white border, which has the effect of drawing over-crossings in the traditional way.
- Go under. The drawn line avoids drawing near previously drawn lines, giving the effect of drawing under-crossings in the traditional way. Shortcut: hold shift while drawing.
- Go through. Just draws a line without any regard for context. This is sometimes useful for touching things up.
Tip: Do not worry about closing things up perfectly. The algorithms in "Convert to diagram" usually figure out what you meant.
Pencil colors are for links with colored components. Components can be recolored later in the diagrams toolbox.
Filters:
- Clean up. Performs morphological thinning, which is the first step "Convert to diagram" goes through to understand the image. This can be useful for seeing what the program sees.
- Thin/thicken. These are not particularly useful, but they either add or remove a 1 pixel border around everything.
Here is what the "Convert to diagram" button does:
- The image is morphologically thinned, which reduces each component to a 1-pixel-thick skeleton. This operation tries to keep the length of each component mostly intact, but it does remove 1 pixel from the ends each time.
- Spurs and negligible components are removed. This is currently set to anything that is at most 5 pixels long.
- If there are any junctions, then the program will mark these and stop processing.
- Now the image is a collection of 1-pixel-thick embedded curves. Arc endpoints are detected.
- Arc endpoints are matched up with straight-line segments, using a heuristic that prefers short segments that cross the rest of the diagram. Then it ensures stability of the assignment, taking pairs of segments and checking if any of the other two possible assignments might be better.
- If any of these line segments intersect (or if any are coincident with the arcs of the diagram), then the program will mark the intersection points and stop processing.
- The data of the curves and the line segments are combined to create a planar graph, and the program switches to the diagrams toolbox.
When there are errors, the program marks them with red disks. These do not need to be erased before clicking "Convert to diagram" again.
Tip: Sometimes the error is that a spur was a little too long. Since 1 pixel is removed from endpoints each time, you might be able to just click "Convert to diagram" again.
Tip: Morphological thinning preserves the homotopy type of each region. This means any small 1 pixel holes in a line are going to cause the program to mark the junctions they will create as errors. Usually, you can just erase the offending region and click "Convert to diagram" (no need to redraw the line).
The image importing toolbox is the interface for taking images of knot diagrams (from papers or from pencil, chalk, or whiteboard drawings) and processing them for the painting toolbox, where they can be touched up more. This mode is a large reason why KnotFolio uses raster graphics rather than vector graphics.
To enter the image importing toolbox, there are a few options:
- Use the file uploading widget in the "Load image" area of the painting toolbox.
- Drag and drop an image onto the KnotFolio window. This image can come from the local filesystem, but it can also come from other web pages (with limited support).
- Paste an image to KnotFolio by clicking anywhere and using the keyboard shortcut Control-V or Command-V.
Due to complexities of files, cross-origin security concerns, and web browsers, there is no guarantee these features will all work. The fancier methods are provided only in a best-effort capacity.
Once you choose good settings, click the "Accept" button to go to the painting toolbox.
The most important part is cropping and moving, which are the two tools in the toolbox.
- Crop image. This selects a portion of the imported image that will actually be used.
- Move image. This lets you translate the cropped portion of the image into the usable area of the canvas. Shortcut: right click and drag.
Then there are the sliders and check boxes:
- Scaling. It helps "Convert to diagram" to have lines that are not too thick, so it is worth scaling the image down. Shortcut: middle mouse wheel, or however you might scroll on your computer.
- Invert colors. If the knot is chalk on a blackboard, check this box.
- Blur. This selects a blur radius, which is useful for removing noise or holes in lines.
- Adaptive radius. This is the size of the area used to estimate the local lighting conditions for thresholding.
- Threshold. This chooses the value with respect to the estimated local lighting conditions for what counts as the knot and what counts as the background.
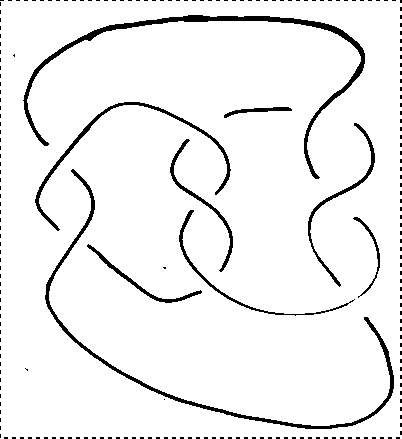
You should choose a setting where the line is reasonably solid without holes, and where the background speckles are either non-existent or small. It is OK if the lines have gaps, but one should avoid having gaps on the overstrands at crossings. This is an example of a good enough choice of settings, despite the small gap in the overstrand in the lower right:

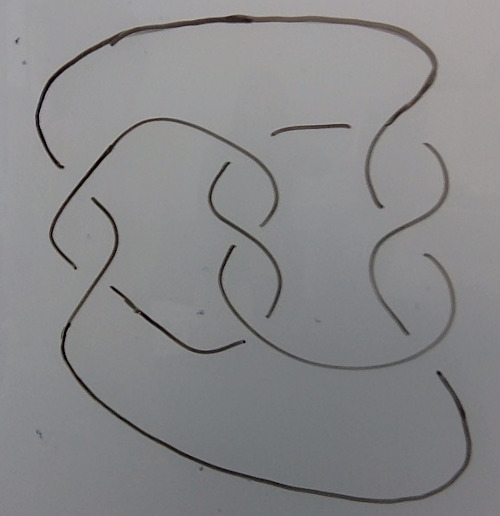
This came from the following whiteboard drawing:

The result of "Convert to diagram" in the painting toolbox is a diagram, which is internally represented as a combinatorial planar map with vertices of degrees 2 and 4.
Tip: this is a good time to make sure the recognized diagram matches the picture. Sometimes it will come up with a surprising yet valid interpretation!
Modification tools:
- Change crossing type. Click on a crossing to change which strand is the overstrand.
- Toggle component orientation. Click on a component to reverse its orientation.
- Delete component. Click on a component to delete it.
- Recolor component to color X. Click on a component to give it a particular color.
- Mirror. Change all crossing types in the diagram.
- Invert. Reverse the orientations of each component in the diagram.
- Make alternating. Change some crossing types so that the result is an alternating diagram.
- Auto-color. Give each component its own color. (If there are more than 16 components, colors will be reused.)
The "Convert to drawing" button makes a best-effort attempt to take the diagram back to the painting toolbox. There is currently no guarantee that "Convert to diagram" will give the diagram back, unfortunately.
Warning: This is alpha software. Take special care that the diagram looks reasonable. This should not be the case anymore, but there was a time when it occasionally let lines cross and give non-classical virtual knots!
Note: At some point there will be isotopy tools for smoothing out the diagram and performing Reidemeister moves and also tools for operations like 1/n Dehn surgery and constructing cablings.
The program gives:
- the crossing number of the diagram (note: this is merely an upper bound for the crossing number)
- the writhe, which is the linking number with the blackboard-framed pushoff
- the linking matrix, which gives linking numbers between each colored sublink of the diagram, where the diagonal is the writhe of that colored sublink
- a PD in a form suitable for KnotTheory or SnapPy
- the Kauffman bracket of the diagram
By using the crossing number, Jones polynomial, and Alexander polynomial, the program consults the KnotInfo and LinkInfo databases to give some guesses for what link it is. Clicking on a candidate brings you to the Knot Atlas entry for the link, if one exists.
- The Jones polynomial is calculated using an expansion in the Temperley-Lieb category. This uses the minimal-frontier heuristic from the Knot Atlas, and this is fast enough that it does not appear to be worth considering planar separators.
- The sequence of Alexander polynomials are calculated by (1) computing the Wirtinger presentation, (2) naively simplifying it as much as possible, (3) computing a presentation matrix of the Alexander module using a "total derivative" version of Fox calculus, (4) calculating the GCD of successive elementary ideals until the GCD is 1. In the convention of the program, Δ0 is the first Alexander polynomial. Higher Alexander polynomials that are 1 are not listed. Warning: The implementation of GCDs easily causes JavaScript's integer type to overflow, which, if detected, causes the program to display an error; at some point we will switch to using the bigint type.
- The Alexander module presentation matrix is a not-too-simplified presentation matrix whose cokernel is the Alexander module.
Notes:
- The Jones and Alexander polynomials are not actually enough to determine a knot. We will at some point compute the HOMFLY polynomial as well.
- The way Alexander polynomials are implemented should make it straightforward to also calculate multivariable Alexander polynomials, where the colors of the components gives the variable assignments. All that is needed is an implementation of multivariable Laurent polynomials with integer coefficients, and, importantly, the ability to compute GCDs of such polynomials.