Processing steps
To compute the whole indicators and classifications, GeoClimate uses the concept of Workflow to chain a set of spatial analysis and statistical processes. By default, the indicators are calculated at the TU scale (cf. subsection Default TU scale calculation) but optionally the user may aggregate indicators spatially at the scale of a grid of rectangular meshes (cf. subsection Spatial aggregation using a regular grid).
The Workflow is organized in 3 steps (Figure 1). Note that each step or each process within a step can be run individually (cf. section Coding implementation). Note also that you can use the workflow even though you do not provide all input data. Partitioning and indicators calculations will be limited to the supplied data.
1. New spatial units creation
The first step of the GeoClimate chain concerns the construction of two new spatial units (block and RSU).
- a block is defined as an aggregation of buildings that are in contact,
- a RSU (Reference Spatial Unit), being the elementary unit to characterize all the characteristics of a piece of land (not only related to buildings but also to vegetation, water, sea, etc.) plus the urban functions (commercial, industrial, military, residential... ). In the default case described here, Topographical Spatial Units (TSU) are used and they are defined as a continuous and homogeneous way to divide the space using topographic constraints based on road and railway center lines, vegetation, water and sea surface boundaries, administrative boundaries and urban function areas. The construction of the TSU is a key process in GeoClimate. First, a planar graph is built using all input geometries. The planar graph is then traversed to generate new polygons. Only 2D is considered for partitioning, therefore underground elements (such as tunnels), or overground (such as bridges) are excluded from the input. Water and vegetation surfaces are also excluded from the input data when they are smaller than a certain threshold, set by default to 2'500 m² for water and 10'000 m² for vegetation. Urban functions are described in the urban areas layer. As for water features, geometries with a surface area greater than 10'000 m² are excluded.
2. Compute spatial indicators
The spatial indicators are computed at three scales : building, block and RSU. Buildings are characterized by their location in a geographical space (e.g distance to the nearest road, average distance to other buildings, number of building neighbor...), building and blocks are characterized by morphological indicators (e.g. a form factor), RSU are characterized by fraction of land type (e.g. vegetation, water, impervious fractions...) and specific climate-oriented indicators (e.g. aspect ratio, mean sky view factor...). Some of the building indicators are also aggregated at block scale (e.g. mean block height) and some of the building and block indicators are aggregated at RSU scale (e.g. mean number of neighbors per building, mean building height...). At the end, more than 100 indicators are calculated.
3. Apply classifications
Classifications use the spatial indicators at the three scales and specific statistical model / algorithms to set:
- the typology of a building based on an architectural approach (Urban Typology by Random Forest - UTRF) such as defined in Bocher et al. (2017) which is then aggregated at RSU scale
- the typology of a RSU based on the Local Climate Zones definition (Stewart et Oke, 2012)
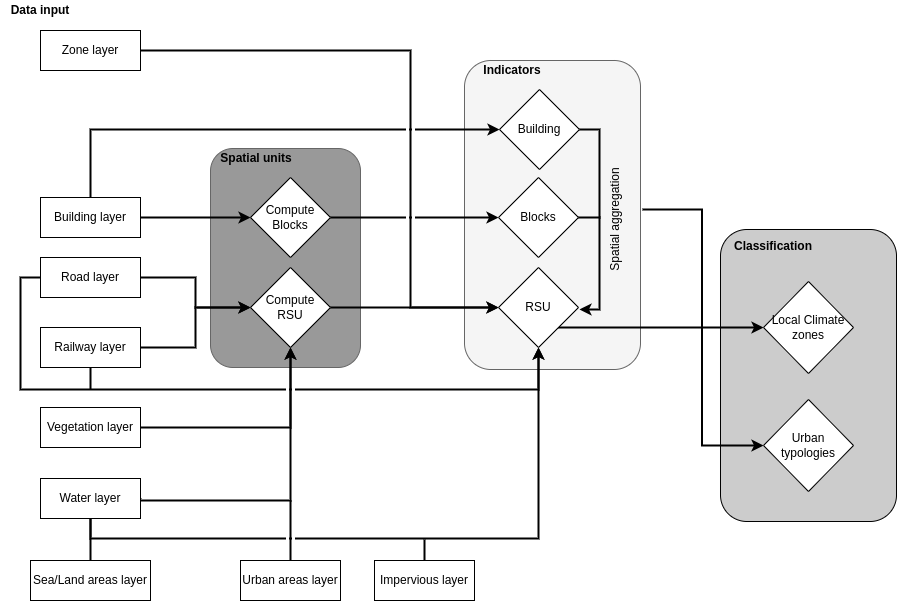
Figure 1. Main GeoClimate processing steps
GeoClimate integrates a "rasterization" of the indicators and of the classifications which can be done directly from the input data sources (if the LCZ classification is not needed) or after applications of the chain defined above (if the LCZ classification is needed). The rasterization process creates a grid based on the bounding box of the zone layer. The grid is intersected with a set of input data given to a spatial aggregating function that computes the square cell fraction of each input data and the building height which is a footprint area weighted mean height (Figure 2).
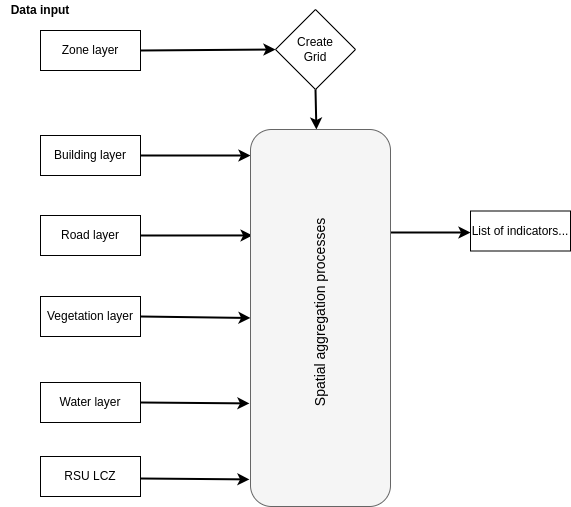
Figure 2. Processing steps to aggregate indicators at grid scale
GeoClimate - documentation 2020 - 2024 -
This work is licensed under a Creative Commons Attribution-ShareAlike 4.0 International.
