Histogram
Mat src = Cv2.ImRead("lenna.png", LoadMode.GrayScale);

// Histogram view
const int Width = 260, Height = 200;
Mat render = new Mat(new Size(Width, Height), MatType.CV_8UC3, Scalar.All(255));

// Calculate histogram
Mat hist = new Mat();
int[] hdims = {256}; // Histogram size for each dimension
Rangef[] ranges = { new Rangef(0,256), }; // min/max
Cv2.CalcHist(
    new Mat[]{src},
    new int[]{0},
    null,
    hist,
    1,
    hdims,
    ranges);

// Get the max value of histogram
double minVal, maxVal;
Cv2.MinMaxLoc(hist, out minVal, out maxVal);

Scalar color = Scalar.All(100);
// Scales and draws histogram
hist = hist * (maxVal != 0 ? Height / maxVal : 0.0);
for (int j = 0; j < hdims[0]; ++j)
{
    int binW = (int)((double)Width / hdims[0]);
    render.Rectangle(
        new Point(j * binW, render.Rows - (int)(hist.Get<float>(j))),
        new Point((j + 1) * binW, render.Rows),
        color,
        -1);
}

using (new Window("Image", WindowMode.AutoSize | WindowMode.FreeRatio, src))
using (new Window("Histogram", WindowMode.AutoSize | WindowMode.FreeRatio, render))
{
    Cv2.WaitKey();
}
Source Image (gray scale)

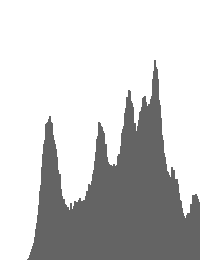
Result Histogram