cosmos-exporter is a Prometheus scraper that fetches the data from a full node of a Cosmos-based blockchain via gRPC.
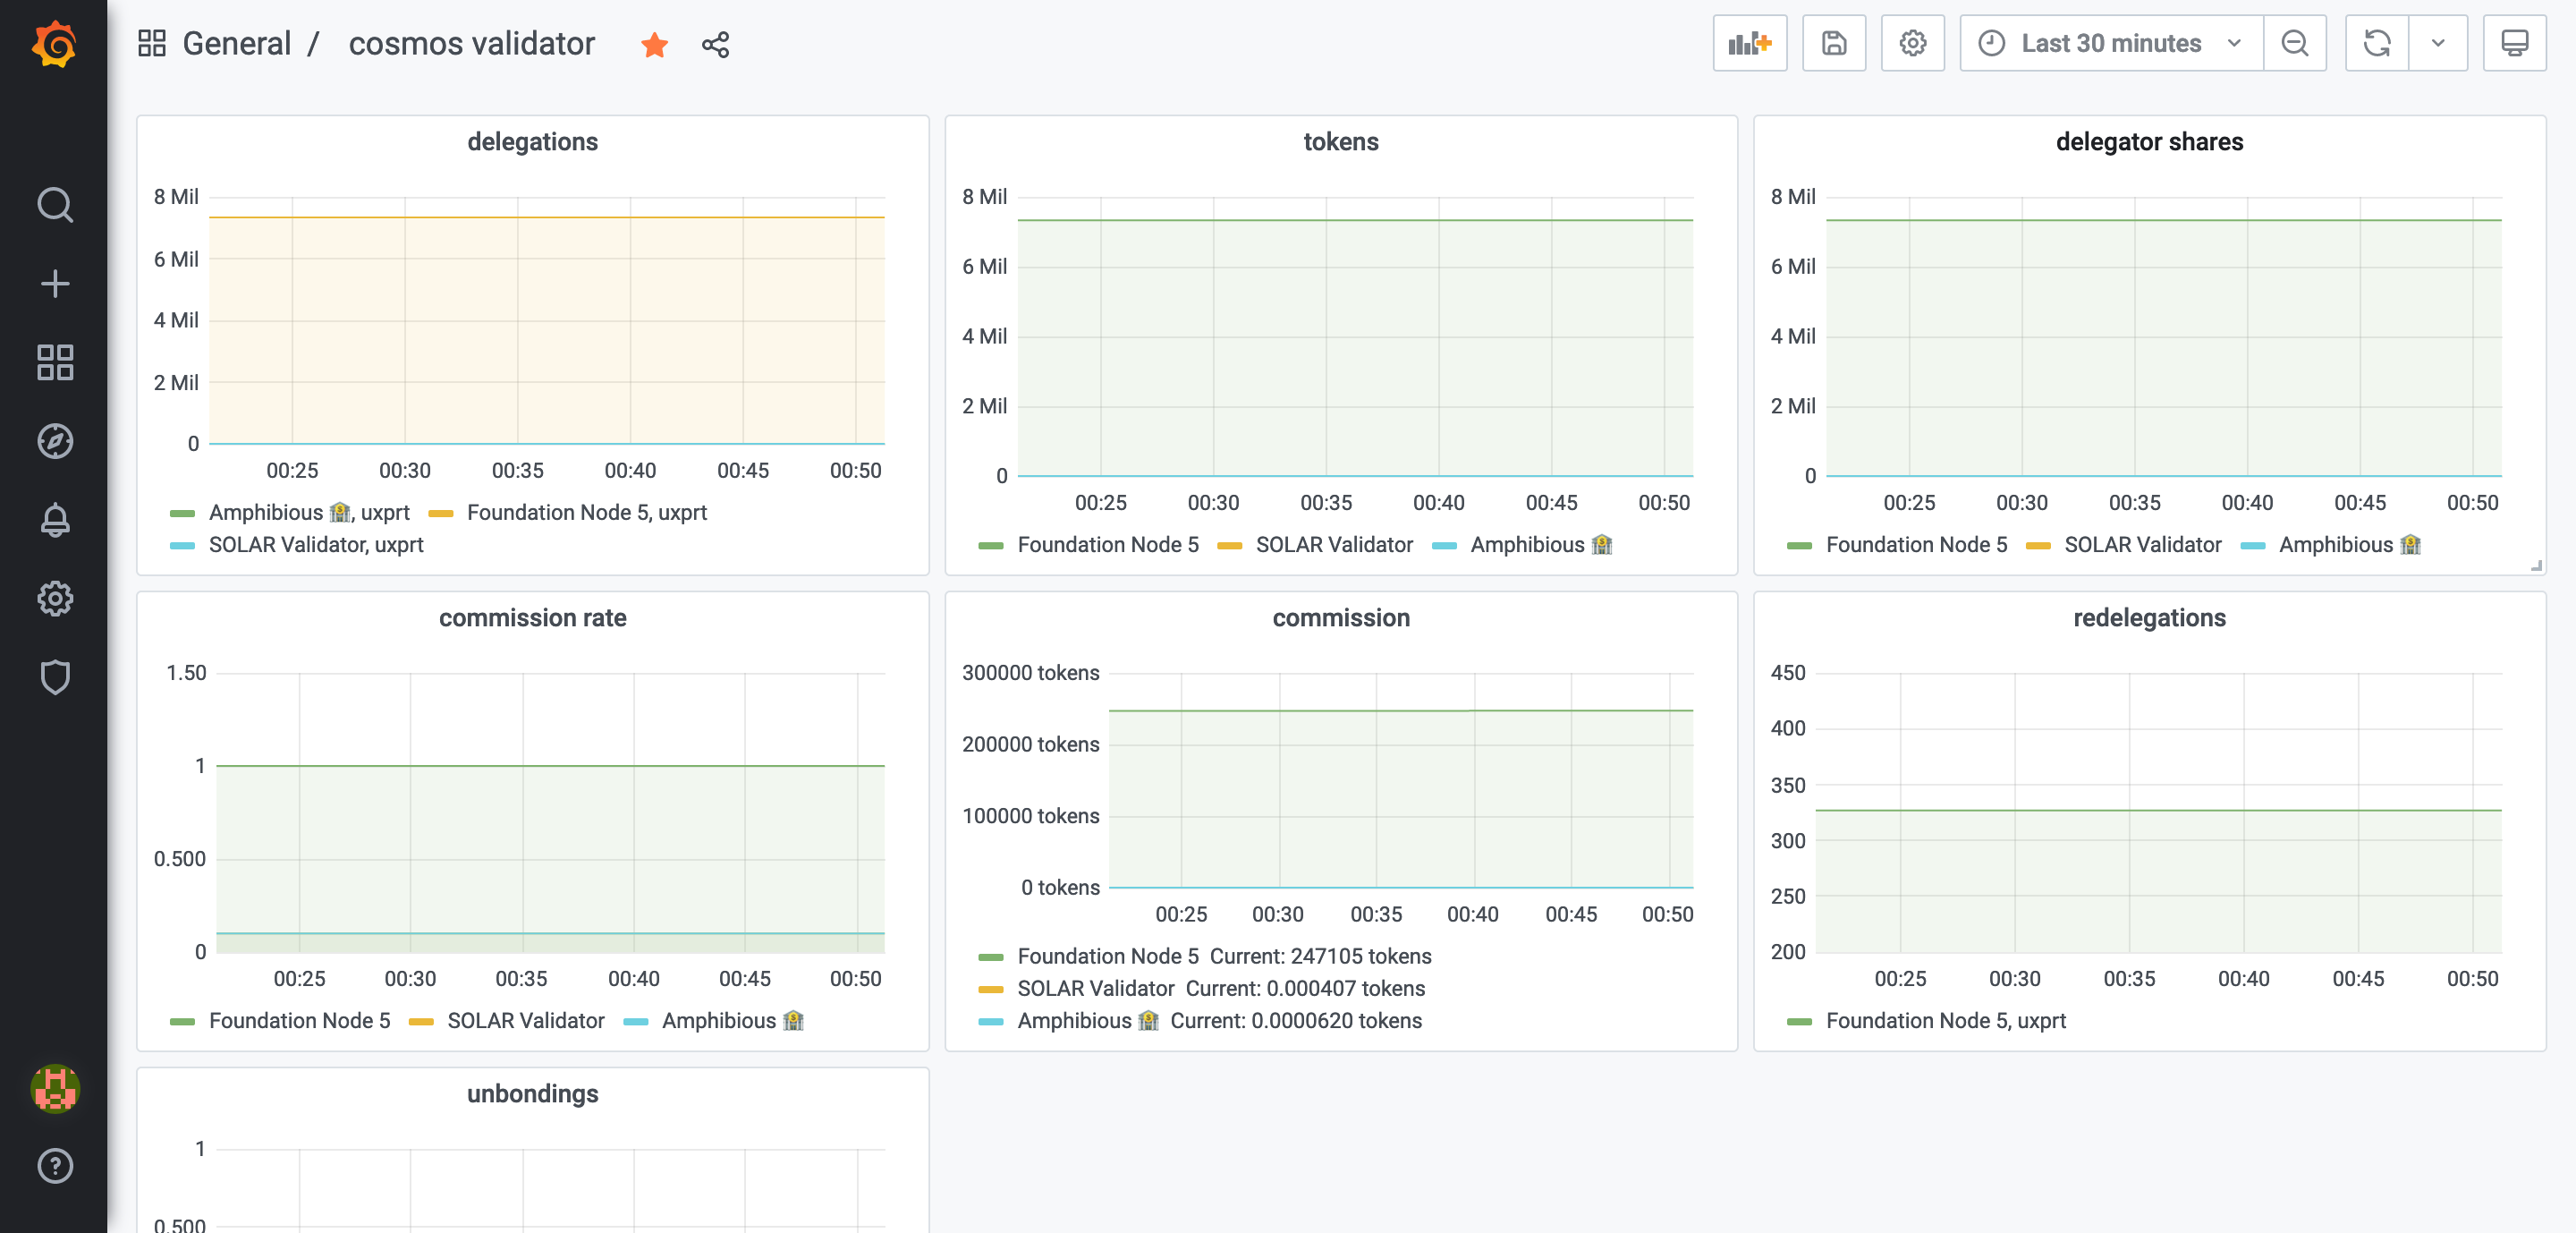
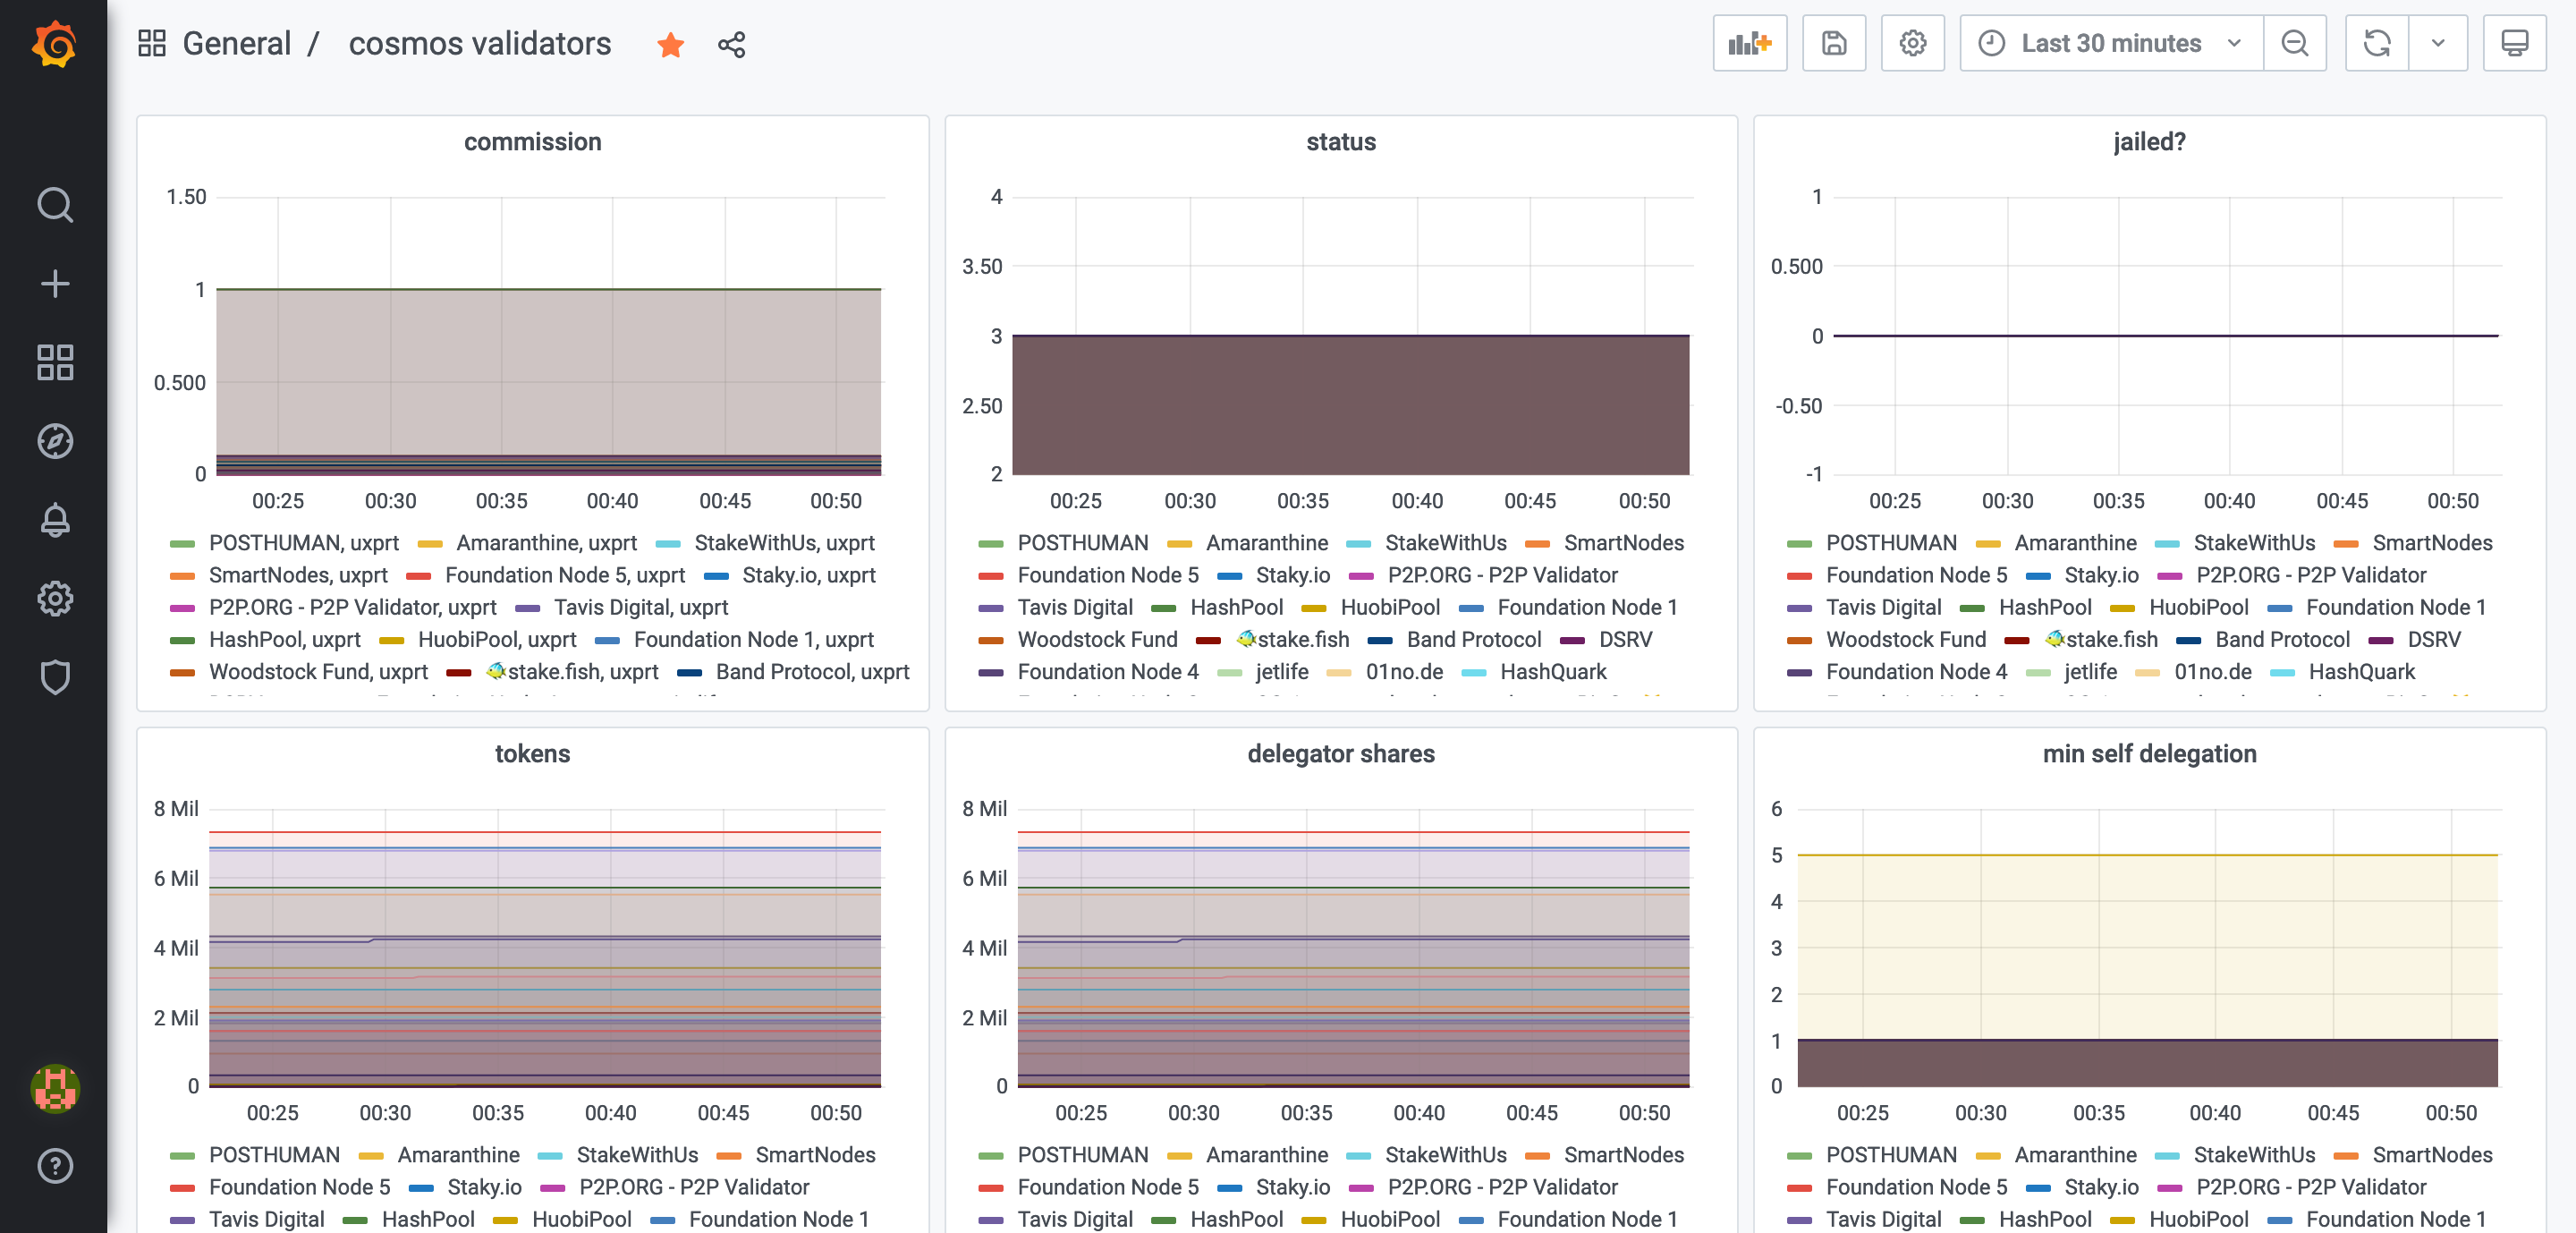
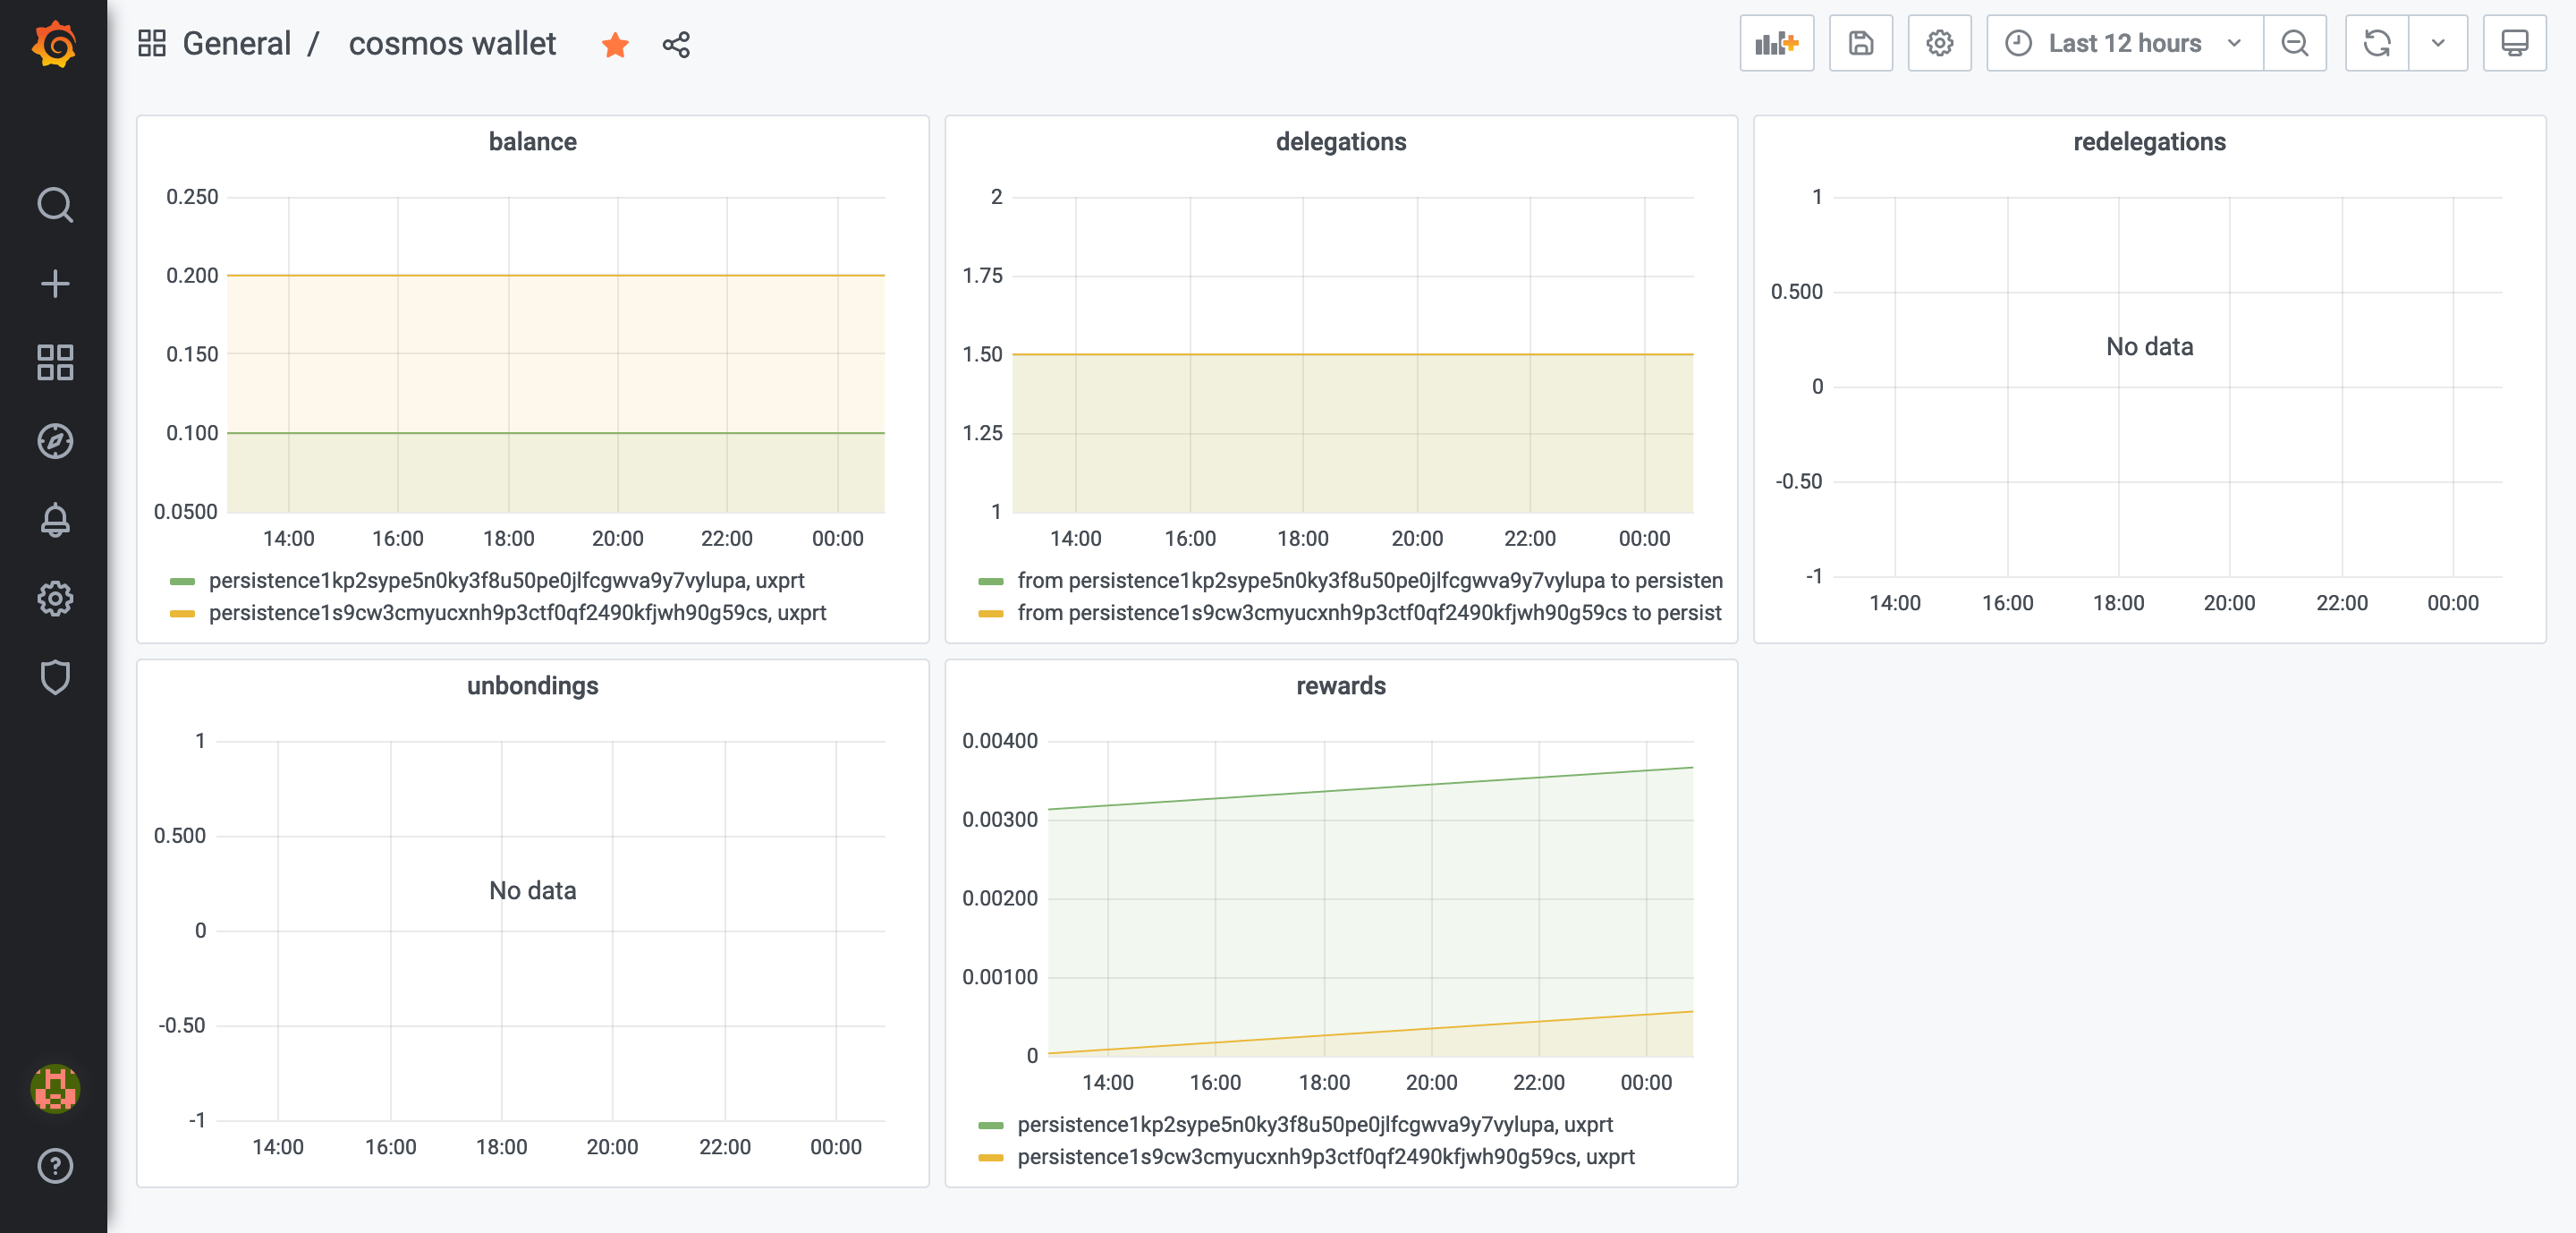
You can run a full node, run cosmos-exporter on the same host, set up Prometheus to scrape the data from it (see below for instructions), then set up Grafana to visualize the data coming from the exporter and probably add some alerting. Here are some examples of Grafana dashboards we created for ourselves:
First of all, you need to download the latest release from the releases page. After that, you should unzip it and you are ready to go:
wget <the link from the releases page>
tar xvfz cosmos-exporter-*
./cosmos-exporter
That's not really interesting, what you probably want to do is to have it running in the background. For that, first of all, we have to copy the file to the system apps folder:
sudo cp ./cosmos-exporter /usr/binThen we need to create a systemd service for our app:
sudo nano /etc/systemd/system/cosmos-exporter.serviceYou can use this template (change the user to whatever user you want this to be executed from. It's advised to create a separate user for that instead of running it from root):
[Unit]
Description=Cosmos Exporter
After=network-online.target

[Service]
User=<username>
TimeoutStartSec=0
CPUWeight=95
IOWeight=95
ExecStart=cosmos-exporter
Restart=always
RestartSec=2
LimitNOFILE=800000
KillSignal=SIGTERM

[Install]
WantedBy=multi-user.target
Then we'll add this service to the autostart and run it:
sudo systemctl enable cosmos-exporter
sudo systemctl start cosmos-exporter
sudo systemctl status cosmos-exporter # validate it's running
If you need to, you can also see the logs of the process:
sudo journalctl -u cosmos-exporter -f --output catHere's the example of the Prometheus config you can use for scraping data:
scrape-configs:
  # specific validator(s)
  - job_name:       'validator'
    scrape_interval: 15s
    metrics_path: /metrics/validator
    static_configs:
      - targets:
        - <list of validators you want to monitor>
    relabel_configs:
      - source_labels: [__address__]
        target_label: __param_address
      - source_labels: [__param_address]
        target_label: instance
      - target_label: __address__
        replacement: <node hostname or IP>:9300
  # specific wallet(s)
  - job_name:       'wallet'
    scrape_interval: 15s
    metrics_path: /metrics/wallet
    static_configs:
      - targets:
        - <list of wallets>
    relabel_configs:
      - source_labels: [__address__]
        target_label: __param_address
      - source_labels: [__param_address]
        target_label: instance
      - target_label: __address__
        replacement: <node hostname or IP>:9300

  # all validators
  - job_name:       'validators'
    scrape_interval: 15s
    metrics_path: /metrics/validators
    static_configs:
      - targets:
        - <node hostname or IP>:9300
Then restart Prometheus and you're good to go!
All of the metrics provided by cosmos-exporter have the following prefixes:
cosmos_validator_*- metrics related to a single validatorcosmos_validators_*- metrics related to a validator setcosmos_wallet_*- metrics related to a single wallet
It queries the full node via gRPC and returns it in the format Prometheus can consume.
You can pass the artuments to the executable file to configure it. Here is the parameters list:
--bech-prefix- the global prefix for addresses. Defaults topersistence--denom- the currency, for example,uatomfor Cosmos. Defaults touxprt--denom-coefficient- the number of decimals,1000000for cosmos. Defaults to1. Can't provide along with--denom-exponent--denom-exponent- the denom exponent,6for cosmos. Defaults to0. Can't provide along with--denom-coefficient--listen-address- the address with port the node would listen to. For example, you can use it to redefine port or to make the exporter accessible from the outside by listening on127.0.0.1. Defaults to:9300(so it's accessible from the outside on port 9300)--node- the gRPC node URL. Defaults tolocalhost:9090--tendermint-rpc- Tendermint RPC URL to query node stats (specificallychain-id). Defaults tohttp://localhost:26657--log-devel- logger level. Defaults toinfo. You can set it todebugto make it more verbose.--limit- pagination limit for gRPC requests. Defaults to 1000.--json- output logs as JSON. Useful if you don't read it on servers but instead use logging aggregation solutions such as ELK stack.
You can also specify custom Bech32 prefixes for wallets, validators, consensus nodes, and their pubkeys by using the following params:
--bech-account-prefix--bech-account-pubkey-prefix--bech-validator-prefix--bech-validator-pubkey-prefix--bech-consensus-node-prefix--bech-consensus-node-pubkey-prefix
By default, if not specified, it defaults to the next values (as it works this way for the most of the networks):
--bech-account-prefix=--bech-prefix--bech-account-pubkey-prefix=--bech-prefix+ "pub"--bech-validator-prefix=--bech-prefix+ "valoper"--bech-validator-pubkey-prefix=--bech-prefix+ "valoperpub"--bech-consensus-node-prefix=--bech-prefix+ "valcons"--bech-consensus-node-pubkey-prefix=--bech-prefix+ "valconspub"
An example of the network where you have to specify all the prefixes manually is Iris, check out the flags example below.
Additionally, you can pass a --config flag with a path to your config file (I use .toml, but anything supported by viper should work).
In theory, it should work on a Cosmos-based blockchains with cosmos-sdk >= 0.40.0 (that's when they added gRPC and IBC support). If this doesn't work on some chains, please file and issue and let's see what's up.
Bug reports and feature requests are always welcome! If you want to contribute, feel free to open issues or PRs.


