- What is the cBioPortal for Cancer Genomics?
- How do I get started?
- What data types are in the portal?
- Can I use figures from the Portal in my publications or presentations?
- How do I cite the portal?
- How is the cBioPortal for Cancer Genomics different from the TCGA Data Portal?
- Why do some cancer studies have mutation data and others do not?
- Does the portal contain cancer study X?
- What kind of clinical data is stored in the portal?
- Does the portal store raw or probe-level data?
- Which methylation probe is used for genes with multiple probes?
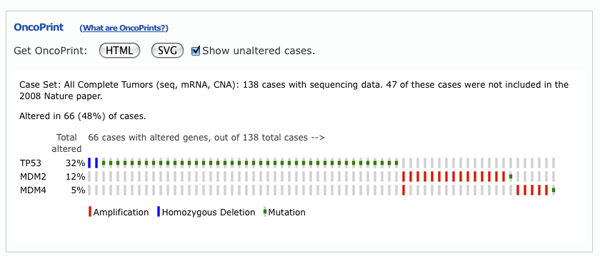
- What are OncoPrints?
- Can I change the order of genes in the OncoPrint?
- Does the portal work on all browsers and operating systems?
- How can I query phosphoprotein levels in the portal?
- How can I query microRNAs in the portal?
- What are mRNA and microRNA Z-Scores?
- Are there any normal samples available through cBioPortal?
- What is GISTIC? What is RAE?
- What do "-2", "-1", "0", "1", and "2" mean in the copy-number data?
- What are the sources of biological network data?
- How does cBioPortal handle duplicate samples or sample IDs across different studies?
- How do I get updates on new portal developments and new data sets?
- What if I have other questions or comments?
The portal stores genomic data from large scale, integrated cancer genomic data sets. It allows explorative data analysis (e.g.: Is my gene of interest altered in a specific cancer type? How frequently is EGFR amplified in glioblastoma? Do mutations of BRCA1 and BRCA2 in ovarian cancer co-occur?) and provides simple download of small data slices (user-defined gene and sample sets, no need to download entire data sets).
We have recently posted two mini-tutorials to get you up and running.
The portal currently stores DNA copy-number data (putative, discrete values per gene, e.g. "deeply deleted" or "amplified", as well as log2 levels), mRNA and microRNA expression data, non-synonymous mutations, protein-level and phosphoprotein level (RPPA) data, DNA methylation data, and limited clinical data related to survival. For a complete breakdown of available data types per cancer study go to the Data Sets Page.
Yes, you are free to use any of the figures from the portal in your publications or presentations (many are available as PDFs for easier scaling and editing). When you do, please cite Cerami et al., Cancer Discov. 2012 and Gao et al. Sci. Signal. 2013.
When using TCGA data in your publications, please adhere to the TCGA publication guidelines.
You can cite the following portal papers:
- Cerami et al. The cBio Cancer Genomics Portal: An Open Platform for Exploring Multidimensional Cancer Genomics Data. Cancer Discovery. May 2012 2; 401. Abstract.
- Gao et al. Integrative analysis of complex cancer genomics and clinical profiles using the cBioPortal. Sci. Signal. 6, pl1 (2013). Reprint.
The cBio portal is an exploratory analysis tool for exploring large-scale cancer genomic data sets. You can quickly view genomic alterations across a set of patients, across a set of cancer types, perform survival analysis and perform network analysis. By contrast, the TCGA Data Portal aims to be the definitive place for full-download and access to all data generated by TCGA. If you want to explore a pathway of interest in one or more cancer types, the cBio portal is probably where you want to start. However, if you want to download raw mRNA expression files or full segmented copy number files, the TCGA Data Portal is probably where you want to start.
We store mutation data for published cancer studies. We do not, however store mutation data for provisional cancer data sets generated by TCGA. This is because provisional studies contain preliminary somatic mutations, which per NCI guidelines cannot be redistributed until they have been validated. As each cancer study is published and finalized by the TCGA, we will import the corresponding mutation data.
Check out the Data Sets Page for the complete set of cancer studies currently stored in the portal. If you do not see your specific cancer study of interest, please contact us directly, and we will let you know if it's in the queue.
The portal currently stores overall and disease-free survival data, when available.
No, the portal only contains gene-level data. Data for different isoforms of a given gene are merged. Raw and probe-level data for all date sets is available via NCBI GEO or through the TCGA Data Portal. See the cancer type description on the main query page for links to the raw data.
For genes with multiple probes, we only include methylation data from the probe with the strongest negative correlation between the methylation signal and the gene's expression.
OncoPrints are compact means of visualizing distinct genomic alterations, including somatic mutations, copy number alterations, and mRNA expression changes across a set of cases. They are extremely useful for visualizing gene set and pathway alterations across a set of cases, and for visually identifying trends, such as trends in mutual exclusivity or co-occurence between gene pairs within a gene set. Individual genes are represented as rows, and individual cases or patients are represented as columns.
The order of genes in the OncoPrint is determined by the order entered into the initial query field. Simply change the initial gene order, resubmit your query, and the change will be reflected in the OncoPrint.
We support and test on the following web browsers: Internet Explorer 9.0 and above, Firefox 3.0 and above, Safari and Google Chrome. If you notice any other incompatibilities, please let us know.
You need to input special IDs for each phosphoprotein/phopshosite such as AKT_pS473 (which means AKT protein phosphorylated at serine residue at position 473). You could also input aliases such as phosphoAKT1 or phosphoprotein, and the portal will ask you to select the phosphoprotein/phosphosite of your interest.
You can input either precusor or mature miRNA IDs. Since one precusor ID may correspond to multiple mature IDs and vise versa, the portal creates one internal ID for each pair of precursor ID and mature ID mapping. For example, an internal ID of MIR-29B-1/29B stands for precursor microRNA hsa-mir-29b-1 and mature microRNA hsa-miR-29b. After entering a precusor or mature ID, you will be asked to select one internal ID for query and that internal ID will also be displayed in the Oncoprint.
For mRNA and microRNA expression data, we typically compute the relative expression of an individual gene and tumor to the gene's expression distribution in a reference population. That reference population is all samples that are diploid for the gene in question (by default for mRNA), or normal samples (when specified), or all profiled samples . The returned value indicates the number of standard deviations away from the mean of expression in the reference population (Z-score). This measure is useful to determine whether a gene is up- or down-regulated relative to the normal samples or all other tumor samples.
No, we currently do not store any normal data in our system.
Copy number data sets within the portal are generated by GISTIC or RAE algorithms. Both algorithms attempt to identify significantly altered regions of amplification or deletion across sets of patients. Both algorithms also generate putative gene/patient copy number specific calls, which are then input into the portal.
For TCGA studies, the table in all_thresholded.by_genes.txt (which is the part of the GISTIC output that is used to determine the copy-number status of each gene in each sample in cBioPortal) is obtained by applying both low- and high-level thresholds to to the gene copy levels of all the samples. The entries with value +/- 2 exceed the high-level thresholds for amps/dels, and those with +/- 1 exceed the low-level thresholds but not the high-level thresholds. The low-level thresholds are just the 'amp_thresh' and 'del_thresh' noise threshold input values to GISTIC (typically 0.1 or 0.3) and are the same for every thresholds.
By contrast, the high-level thresholds are calculated on a sample-by-sample basis and are based on the maximum (or minimum) median arm-level amplification (or deletion) copy number found in the sample. The idea, for deletions anyway, is that this level is a good approximation for hemizygous given the purity and ploidy of the sample. The actual cutoffs used for each sample can be found in a table in the output file sample_cutoffs.txt. All GISTIC output files for TCGA are available at: gdac.broadinstitute.org.
These levels are derived from the copy-number analysis algorithms GISTIC or RAE, and indicate the copy-number level per gene. "-2" is a deep loss, possibly a homozygous deletion, "-1" is a shallow loss (possibly heterozygous deletion), "0" is diploid, "1" indicates a low-level gain, and "2" is a high-level amplification. Note that these calls are putative.
The sources of biological network data are listed here.
The cBioPortal assumes that samples or patients that have the same ID are actually the same. This is important for cross-cancer queries, where each sample should only be counted once. If a sample is part of multiple cancer cohorts, its alterations are only counted once in cross-cancer summaries: while it is listed multiple times in cross-cancer mutation tables, it is only counted once in summary statistics (e.g., alteration frequencies) and in mutation diagrams. To avoid any confusion and miscounts, all sample IDs in cBioPortal of samples that are different should be unique, and identical samples in different cohorts should use the same ID.
Please subscribe to our low-traffic news mailing list or follow us on Twitter.
Please contact us at [email protected]. Previous discussions about cBioPortal are available on the user discussion mailing list.