ArticleUkfsst
Ukfsst is an add-on package for the statistical environment R to efficiently estimate movement parameters and predict the most probable track from raw light-based geolocations and sea surface temperatures (SST). This package offers an approach to use both types of information in one coherent state-space model and carries out the estimation via the unscented Kalman filter (UKF).
- Ukfsst - Lam, Chi H., Anders Nielsen, and John R. Sibert, 2008. Improving light and temperature based geolocation by unscented Kalman filtering. Fisheries Research, 91: 15-25
Ukfsst comes with a function explaining how to fit a track. It covers all steps from how to read in the raw track, automatically obtain SST-field, fit the track, and plot and investigate the final track. This help is displayed by typing:
road.map()Also the package comes with a complete example. To see it type:
example(blue.shark)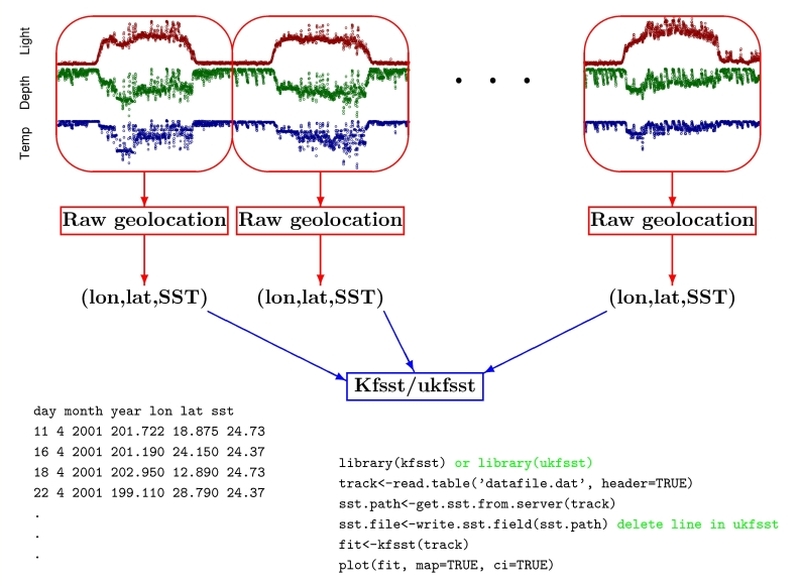
> track
   day month year  obsLon obsLat obsSst
    10     9 2002  198.04  23.09   30.6
    11     9 2002  198.11  50.50   30.7
12 9 2002 197.65 45.50 30.6# Note: delete the hash sign (#) at the beginning to uncomment a line
library(ukfsst)
track<-read.table("datafile.dat", header=TRUE) # change file name and path for your own file
sst.path <- get.sst.from.server(track)
# see function, get.blended.sst
# for usage with higher-resolution SST imagery
fit<-kfsst(track)
plot(fit)- Read in a track
- Obtain a corresponding SST-field
- Reconstruct the track
- Investigate the fitted track by plots and summaries
This problem will appear in the Eastern Atlantic when an animal crosses 0/360 longitude. Even though Ukfsst doesn't natively handle this problem, there is a getaround. It involves adding an offset to the raw longitude values to shift the longitude values to a continuous scale, instead of having a sharp break at 0/360. To achieve that, these are the steps:
  > head(track)
  day month year       lon      lat   sst
    9     1 2003 -75.01227 34.84846 21.30
   10     1 2003 -78.88831 38.14712 20.10
   11     1 2003 -78.28817 32.53389 19.10
   12     1 2003 -77.94039 26.73982 14.31
   13     1 2003 -77.84508 33.51983 16.50
   14     1 2003 -78.00233 39.64455 18.09

  > tail(track)
 day month year      lon      lat   sst
  28    10 2004 15.69613 32.13621 23.18
  29    10 2004 16.18055 27.32399 23.07
  30    10 2004 15.41815 29.59003 22.89
  31    10 2004 15.65907 29.82971 22.67
   1    11 2004 15.40330 30.06093 22.78
1 11 2004 13.31000 40.74000 22.78 ### The modified longitude values need to stay within 0-360
### An offset of 200 is added here:
myoffset = 200
track$lon <- track$lon + myoffset
maxlon = max(track$lon) + 10
> range(track$lon)
[1] 121.1117 216.1805
> maxlon
[1] 226.1805- First use a modified SST download function
require(devtools)
source_url('https://github.com/positioning/kalmanfilter/raw/master/support/ukfsst/get-reynolds.R')- Input arguments include a request of SST data from 0 to 360 longitude, so that everything is downloaded
- Then apply an offset to the downloaded files, via the argument,
offsetx - Finally, trim extra SST data to keep files smaller and within bounds, via the argument,
offset.cutoff
sst.path<-get.reynolds(track[,c(3,2,1)], lonlow=0, lonhigh=360, latlow=18, lathigh=50,
minus180=T, offsetx= myoffset, offset.cutoff= maxlon) - Once download is complete, you are good to go!
- Lastly, make sure once you have obtained a fit, substract the offset from the fitted object.
# Revert back to -180 to 180

fit$most.prob.track[,1] <-  fit$most.prob.track[,1] - myoffset
fit$nominal.track[,1] <-  fit$nominal.track[,1] - myoffset
fit$pred.track[,1] <- fit$pred.track[,1] - myoffsetWhen getting unrealistic movement raw data (generally latitudinal), should I discarded them before running the model or will it handle those events efficiently?
Yes, you can experiment with throwing out outliers one at a time (then run model after each elimination), or you take them all out before trying a model. You can compare the model results as you clean out the raw data more and more. You generally do not want to be over-aggressive and "trim" the raw data too much, as it would become increasingly more subjective, which is not what you want.
The preferred way to eliminate an outlier is to assign that longitude/ latitude/ SST as missing, i.e. NA. Ukfsst can withstand 1 missing value in a row of raw data (Lon, Lat, SST), so that the rest of the data can still be utilize in the model. For example, this is OK:
  > head(track)
  day month year       lon      lat   sst
    9     1 2003 175.01227 34.84846 21.30
   10     1 2003 178.88831 38.14712 20.10
   11     1 2003 178.28817 32.53389 NA
   12     1 2003 177.94039 26.73982 14.31
   13     1 2003 177.84508 NA 		16.50
   14     1 2003 NA		   39.64455 18.09
When using I get horizontal (i.e. longitudinal) elipses as a location confidence region, is this correct or did something go wrong?
The ellipses should look like nice ellipses (round) but not thin dotted lines. If you see dotted lines, the model is mis-specified. Feel free to send a screenshot to confirm. You can usually get around this by setting bx.a=F, and/ sx.a=F, or sometimes in combination. Basically, try an alternative set of model parameters, get convergence and inspect the ellipses again.